Hello,
let me first say that I know that once a similar class has be proposed, namely this one: A graph type object with configurable stat/sys errors
Anyhow I decided to write an implementation for this purpose on my own because there were a few things bothering me with the previously proposed class:
- It does not inherit from TGraph and thereby reinvents the wheel
- It does not contain an easy constructor taking arrays like all other TGraph objects
- It uses very differnt naming conventions than other TGraph objects for both functions and drawing options.
There are a few more, but I don’t want to write them all here.
My own implementation is named TGraphMultiErrors and is basically a TGraphAsymmErrors with the possibility to include an unlimited amount of different types of y-Errors.
The whole functionality and naming convention of my class is strongly based on the TGraphAsymmErrors class. All functionalities of the TGraphAsymmErrors have been reimplemented. Furthermore like any other TGraph class it inherits from TGraph and has therefore all of it’s functionalities.
Here you have a small example plot, the sourcefiles of the class and the code to produce the example plot:
tgraphmultierrors.h (9.6 KB)
tgraphmultierrors.cc (82.2 KB)
Example.C (12.4 KB)
Since the class reimplements all functionalities of TGraphAsymmErrors, you can refer to it’s documentation for most functionalities: https://root.cern.ch/doc/master/classTGraphAsymmErrors.html
Differences to TGraphAsymmErrors
Everywhere TGraphAsymmErrors uses arrays for the y-Errors, my class uses two dimensional arrays (Double_t**) of which the first dimension represents the index of the error dimension and the second one the point. It is assumed that the first y-Error is the statistical one and all following are systematical ones. Therefore when the statistical errors are being computed by a function everything applies to only the first error dimension.
In case a single error on y is required (Like for fitting) the errors are being summed according to the value of fSumErrorsMode which can be at the moment TGraphMultiErrors::kOnlyFirst for only returning the error of the first error type (usally the statistic one), TGraphMultiErrors::kSquareSum for returning the squared sum of the errors of all types (Gaussian propagation) or TGraphMultiErrors::kSum for just returning the sum of the errors from all error types.
Drawing / Painting
The painting is being performed by the functions TGraphMultiErrors::Paint, TGraphMultiErrors::PaintReverse and TGraphMultiErrors::PaintGraphMultiErrors. If this class should ever become part of ROOT the first two are to be deleted, cause there are similar functions in the class TGraphPainter and the last one is supposed to be included in the TGraphPainter class.
- The function TGraphMultiErrors::Paint is similar to TGraph::Paint and TGraphPainter::PaintHelper and can be deleted if the class should become part of root and TGraphMultiErrors::PaintGraphMultiErrors is being included in the TGraphPainter class.
- The function TGraphMultiErrors::PaintReverse serves the same purpose as TGraphPainter::PaintReverse and should be deleted too if the class becomes part of ROOT.
- The function TGraphMultiErrors::PaintGraphMultiErrors performs the actual painting and would have to be included in the TGraphPainter class.
Drawing / Painting options
To be able to define different drawing options for the multiple error dimensions the option string can consist of multiple blocks separated by semicolons. The painting method separates the options in multiple options for each y error dimension and one for basic painting and the x errors. In case there are <= NErrorDimensions blocks given, the first block is used for basic painting and for the first dimension of y errors. Y error dimensions without an individual block are painted with “”.
Tn case there are NErrorDimensions + 1 given, the first block is used only for basic painting. The remaining blocks are distributed over the y error dimensions In case there are > NErrorDimensions + 1 blocks given an error is returned. All drawing options of TGraphAsymmErrors are implemented. For explanation of the drawing options see TGraphPainter::PaintGraphAsymmErrors.
Additionally one can specify x0 or y0 to skip points with x = 0 or y = 0 The Draw option s=%f can be used to multiply the corresponding x errors with %f. This is useful in combination with e.g. option 2 if the boxes are supposed to have only half the width of the bin, in this case the option would be s=0.5. Per default the Fill and Line Styles of the Graph are being used for all error dimensions. To use the specific ones add the draw option s to the first block.
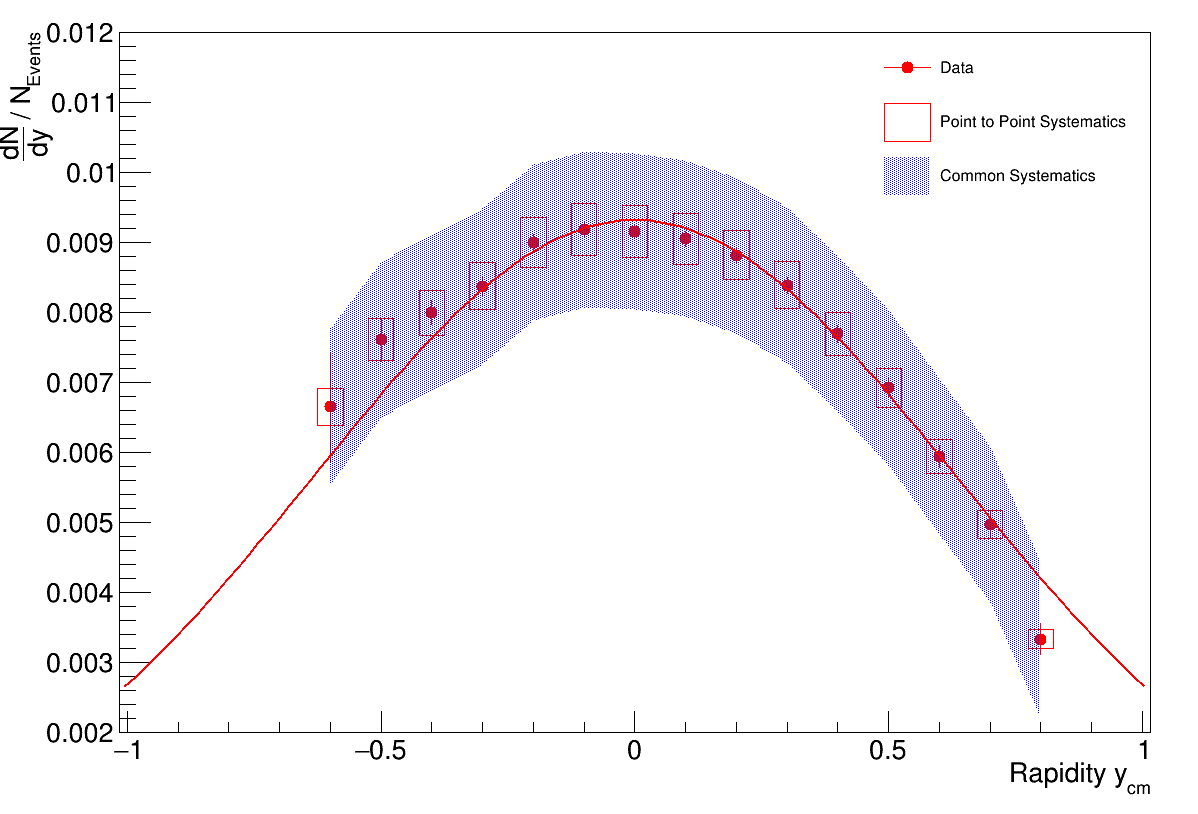
In my example plot the drawing options are “A P X Y0 S ; Z ; 5 s=0.5 ; 3” which means the graph is drawn with Axes, Markers, no Errors on X, no errors on points with y = 0 and individual Fill and Line attributes for all error dimensions for the general part. The first error dimension (statistical errors) is drawn with lines without anything on their tip. The second error dimension (Point to Point Systematics) is drawn with boxes of half the width of the X-Errors. The third error dimension (Common Systematics) is drawn as an filled error band.
I hope you find my class as useful as I do and vote for it to become part of ROOT in the future. 
If you encounter any problems, please feel free to contact me on the forum or leave a comment and I will see what I can do to resolve it.
ROOT Version: 6.12.06
Platform: Debian 3.16.59-1
Compiler: g++ 4.9.2
I am using ROOT 6.12.06 cause that is what our collaboration is currently using but I don’t see any reason why it should not run on other versions of ROOT 6.
