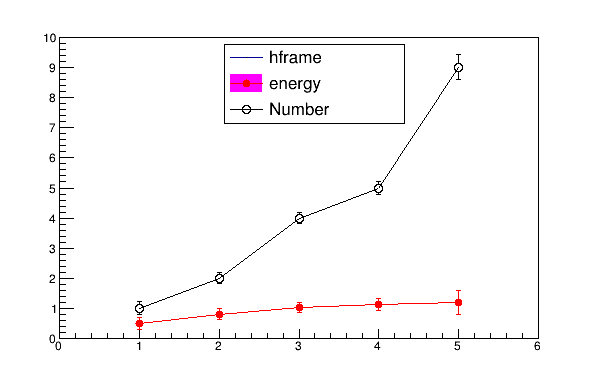
Hi, I would like to plot two TGraphErrors with type “char” on the X axis. I have tried writing this script below but it doesn’t work well. can someone help me
{
auto c43 = new TCanvas("c43","c43",200,10,600,400);
c43->DrawFrame(0., 0.2, 6., 1.6);
double x[5] = {1, 2, 3, 4,5};
double zero[5] = {0, 0, 0, 0, 0};
// Number collecte
double py1[5] = {30, 72, 12, 5, 67 };
double ey_stat1[5] = {0.2, 0.18, 0.17, 0.2, 0.4};
double ey_sys1[5] = {0.5, 0.71, 0.76, 0.5, 0.45};
// Energies
double y2[5] = {0.51, 0.79, 1.02, 1.14, 1.18};
double ey_stat2[5] = {0.2, 0.18, 0.17, 0.2, 0.4};
double ey_sys2[5] = {0.63, 0.19, 0.7, 0.2, 0.7};
///////////////////////////////// 1 ///////////////////////////////////////
auto graph1 = new TGraphErrors(5, x, py1, zero, ey_stat1);
graph1->SetMarkerStyle(20);
graph1->SetMarkerColor(2);
graph1->SetFillColor(6);
graph1->SetLineColor(2);
graph1->Draw("Lp");
gPad->Update();
TAxis *X1 = graph1->GetXaxis();
X1->SetNdivisions(9);
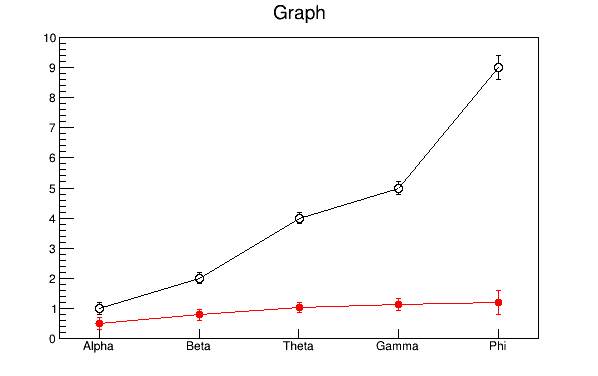
X1->ChangeLabel(1,-1,-1,-1,-1,-1,"Alpha");
X1->ChangeLabel(2,-1,-1,-1,-1,-1,"Beta");
X1->ChangeLabel(3,-1,-1,-1,-1,-1,"Theta");
X1->ChangeLabel(4,-1,-1,-1,-1,-1,"Gamma");
X1->ChangeLabel(5,-1,-1,-1,-1,-1,"Phi");
gPad->Modified();
gPad->Update();
///////////////////////////////// 2 /////////////////////////////////////////
auto graph2 = new TGraphErrors(5, x, y2, zero, ey_stat2);
graph2->SetMarkerStyle(24);
graph2->Draw("LP");
gPad->Update();
TAxis *X = graph2->GetXaxis();
X->SetNdivisions(9);
X->ChangeLabel(1,-1,-1,-1,-1,-1,"Alpha");
X->ChangeLabel(2,-1,-1,-1,-1,-1,"Beta");
X->ChangeLabel(3,-1,-1,-1,-1,-1,"Theta");
X->ChangeLabel(4,-1,-1,-1,-1,-1,"Gamma");
X->ChangeLabel(5,-1,-1,-1,-1,-1,"Phi");
gPad->Modified();
gPad->Update();
}
Please read tips for efficient and successful posting and posting code
ROOT Version: Not Provided
Platform: Not Provided
Compiler: Not Provided