Please read tips for efficient and successful posting and posting code
_ROOT Version: _6.22.06
Platform: Not Provided
Compiler: Not Provided
Hello everyone!
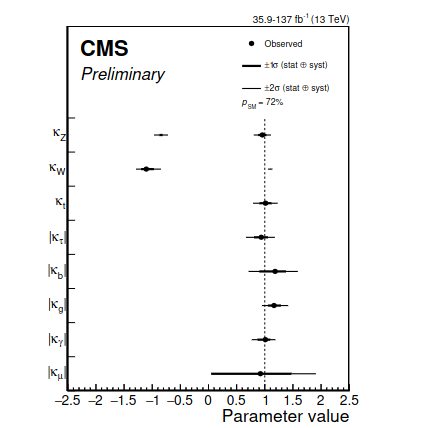
I want to plot the values with error bar only in one axis and on the other axis there will be only names of the variables I am plotting. I have uploaded a file where the expected plot is shown. If anyone can help me how to do this, it will be great for me.
Thanking you in advance,
With regards,
Arpita