Hi all,
Can somebody please tell me how to print X and Y values of this TGraphErrors object?
Best,
Ashish
Do you mean on the plot or a via a screen dump ?
TGraph::Print() will do a screen dump.
But your X axis is really ugly.
Can you post the script producing this plot ?
You can also use the GetX() and GetY() functions of the TGraphErrors class to access the X and Y values of the data points.
Here is an example of how you would print the X and Y values of a TGraphErrors object:
double *X = gr->GetX();
double *Y = gr->GetY();

for (int i = 0; i < gr->GetN(); i++) {
    cout << "X: " << X[i] << " Y: " << Y[i] << endl;
}
thank you very much. This is working.
Yes cosmetics of the X axis can be improved. But it is not priority for me right now. I only need X and Y values.
Thx
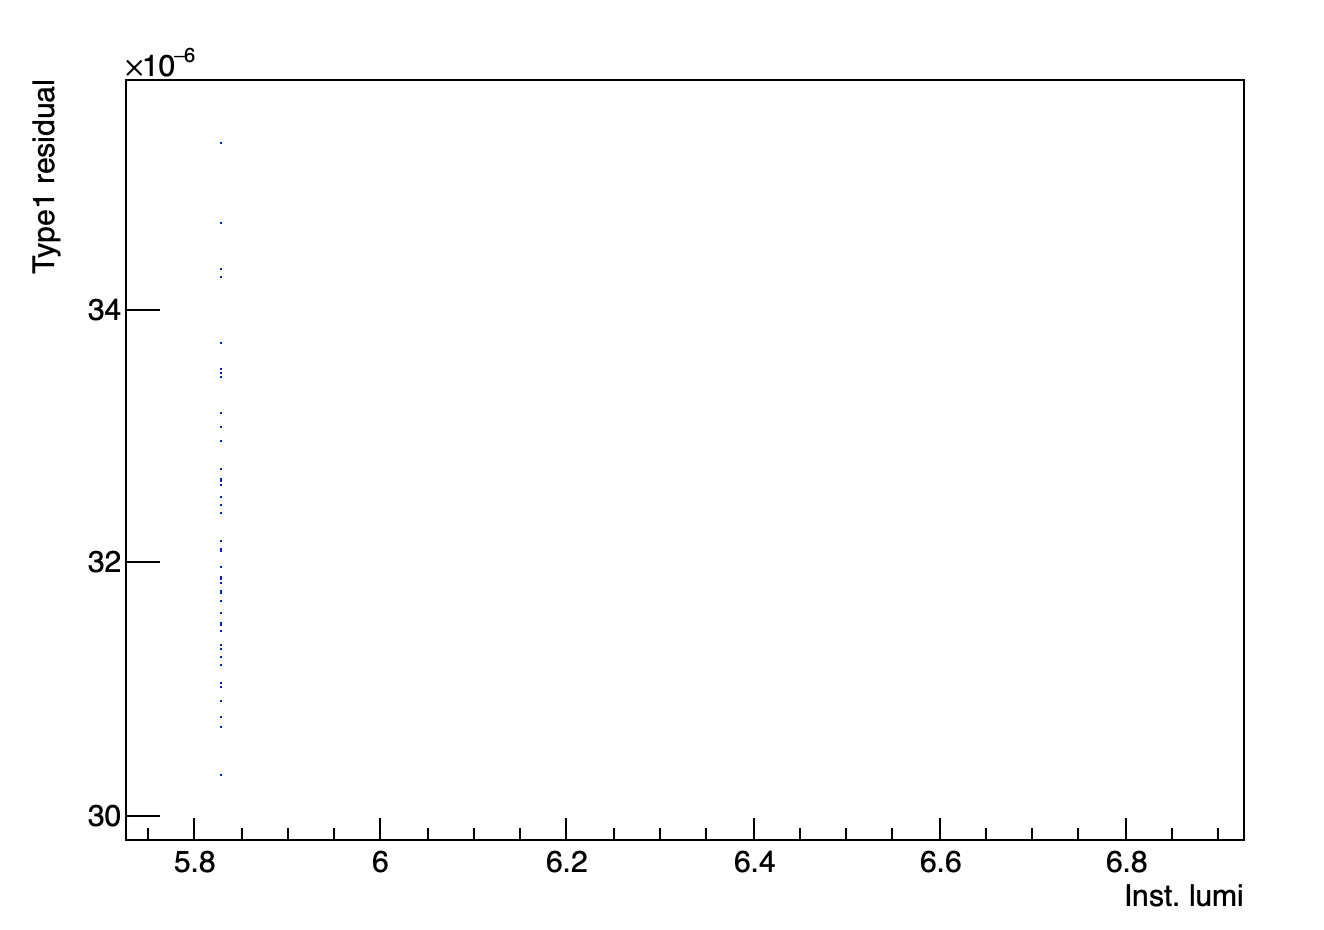
I have the following code but I see only one luminosity value in the residual vs luminosity graph. Can you please help me fix the loops in this code so that residualvsinstlumi graph is filled with all bincontent_avg values?
316766.root (2.8 MB)
#include"globals.h"
#include <iostream>
#include <vector>
#include <dirent.h>
void afterglow_residualvsLumi() {
TString inpath=" ";
TString outpath=" ";;
TCanvas*C = new TCanvas("residual vs inst lumi");
C->cd();
std::vector<int> run;
run = {316766};
TGraphErrors* residual_type1;
TGraph* residualvsinstlumi;
int x_value;
float bincontent;
float bincontent_total;
float bincontent_avg;
for (unsigned int i=0;i<run.size();i++){
TFile Afterglow(inpath+"/"+run.at(i)+".root");
//cout<<"Run "<<run.at(i)<<" "<<inpath<<endl;
residualvsinstlumi=new TGraph();
residual_type1 = (TGraphErrors*)Afterglow.Get("Type1Res");
TIter next(Afterglow.GetListOfKeys());
TObject* key;
while ((key = next())) {
TString kname(key->GetName());
if(!kname.Contains("CorrectedLumiAvg")) continue;
TObjArray * a = kname.Tokenize("_");
long r=atoi(((TObjString*)(*a)[1])->GetName());
long l=atoi(((TObjString*)(*a)[2])->GetName());
long ls1=atoi(((TObjString*)(*a)[3])->GetName());
long ls2=atoi(((TObjString*)(*a)[4])->GetName());
//std::cout<<r<<" "<<l<<" "<<ls1<<" "<<ls2<<std::endl;
if(r!=run.at(i)) continue;
TH1F* Lumi = (TH1F*) Afterglow.Get(TString("CorrectedLumiAvg_")+r+"_"+l+"_"+ls1+"_"+ls2);
if(!Lumi) continue;
for(int j = 1; j <= Lumi->GetNbinsX(); j++) {
x_value = Lumi->GetBinCenter(j);
bincontent = Lumi->GetBinContent(j);
bincontent_total+=bincontent;
}
bincontent_avg=bincontent_total/(9229*Lumi->GetNbinsX());
std::cout<<bincontent_total<<" "<<bincontent_avg<<" "<<std::endl;
//residualvsinstlumi->SetPoint(residualvsinstlumi->GetN(), bincontent_avg, Y[k]);
//std::cout<<residualvsinstlumi->GetN()<<" "<<bincontent_avg<<" "<<Y[k]<<std::endl;
Lumi->SetTitle(TString("Run: ")+run.at(i)+" , LS: "+ls1+" - "+ls2);
Lumi->GetYaxis()->SetTitle("Corrected counts");
Lumi->GetYaxis()->SetNdivisions(4);
Lumi->GetXaxis()->SetTitle("bcid");
Lumi->SetMarkerColor(4);
Lumi->Draw("hist");
//C->Print(outpath+"/compareRandomRawCorr_"+run.at(i)+"_"+l+"_"+ls1+"_"+ls2+".pdf");
}
//}
double *X = residual_type1->GetX();
double *Y = residual_type1->GetY();
for (int k = 0; k < residual_type1->GetN(); k++) {
cout << "X: " << X[k] << " Y: " << Y[k] << endl;
//}
residualvsinstlumi->SetPoint(residualvsinstlumi->GetN(), bincontent_avg, Y[k]);
//std::cout<<x_value<<" "<<bincontent_avg<<" "<<Y[k]<<" "<<std::endl;
}
//}
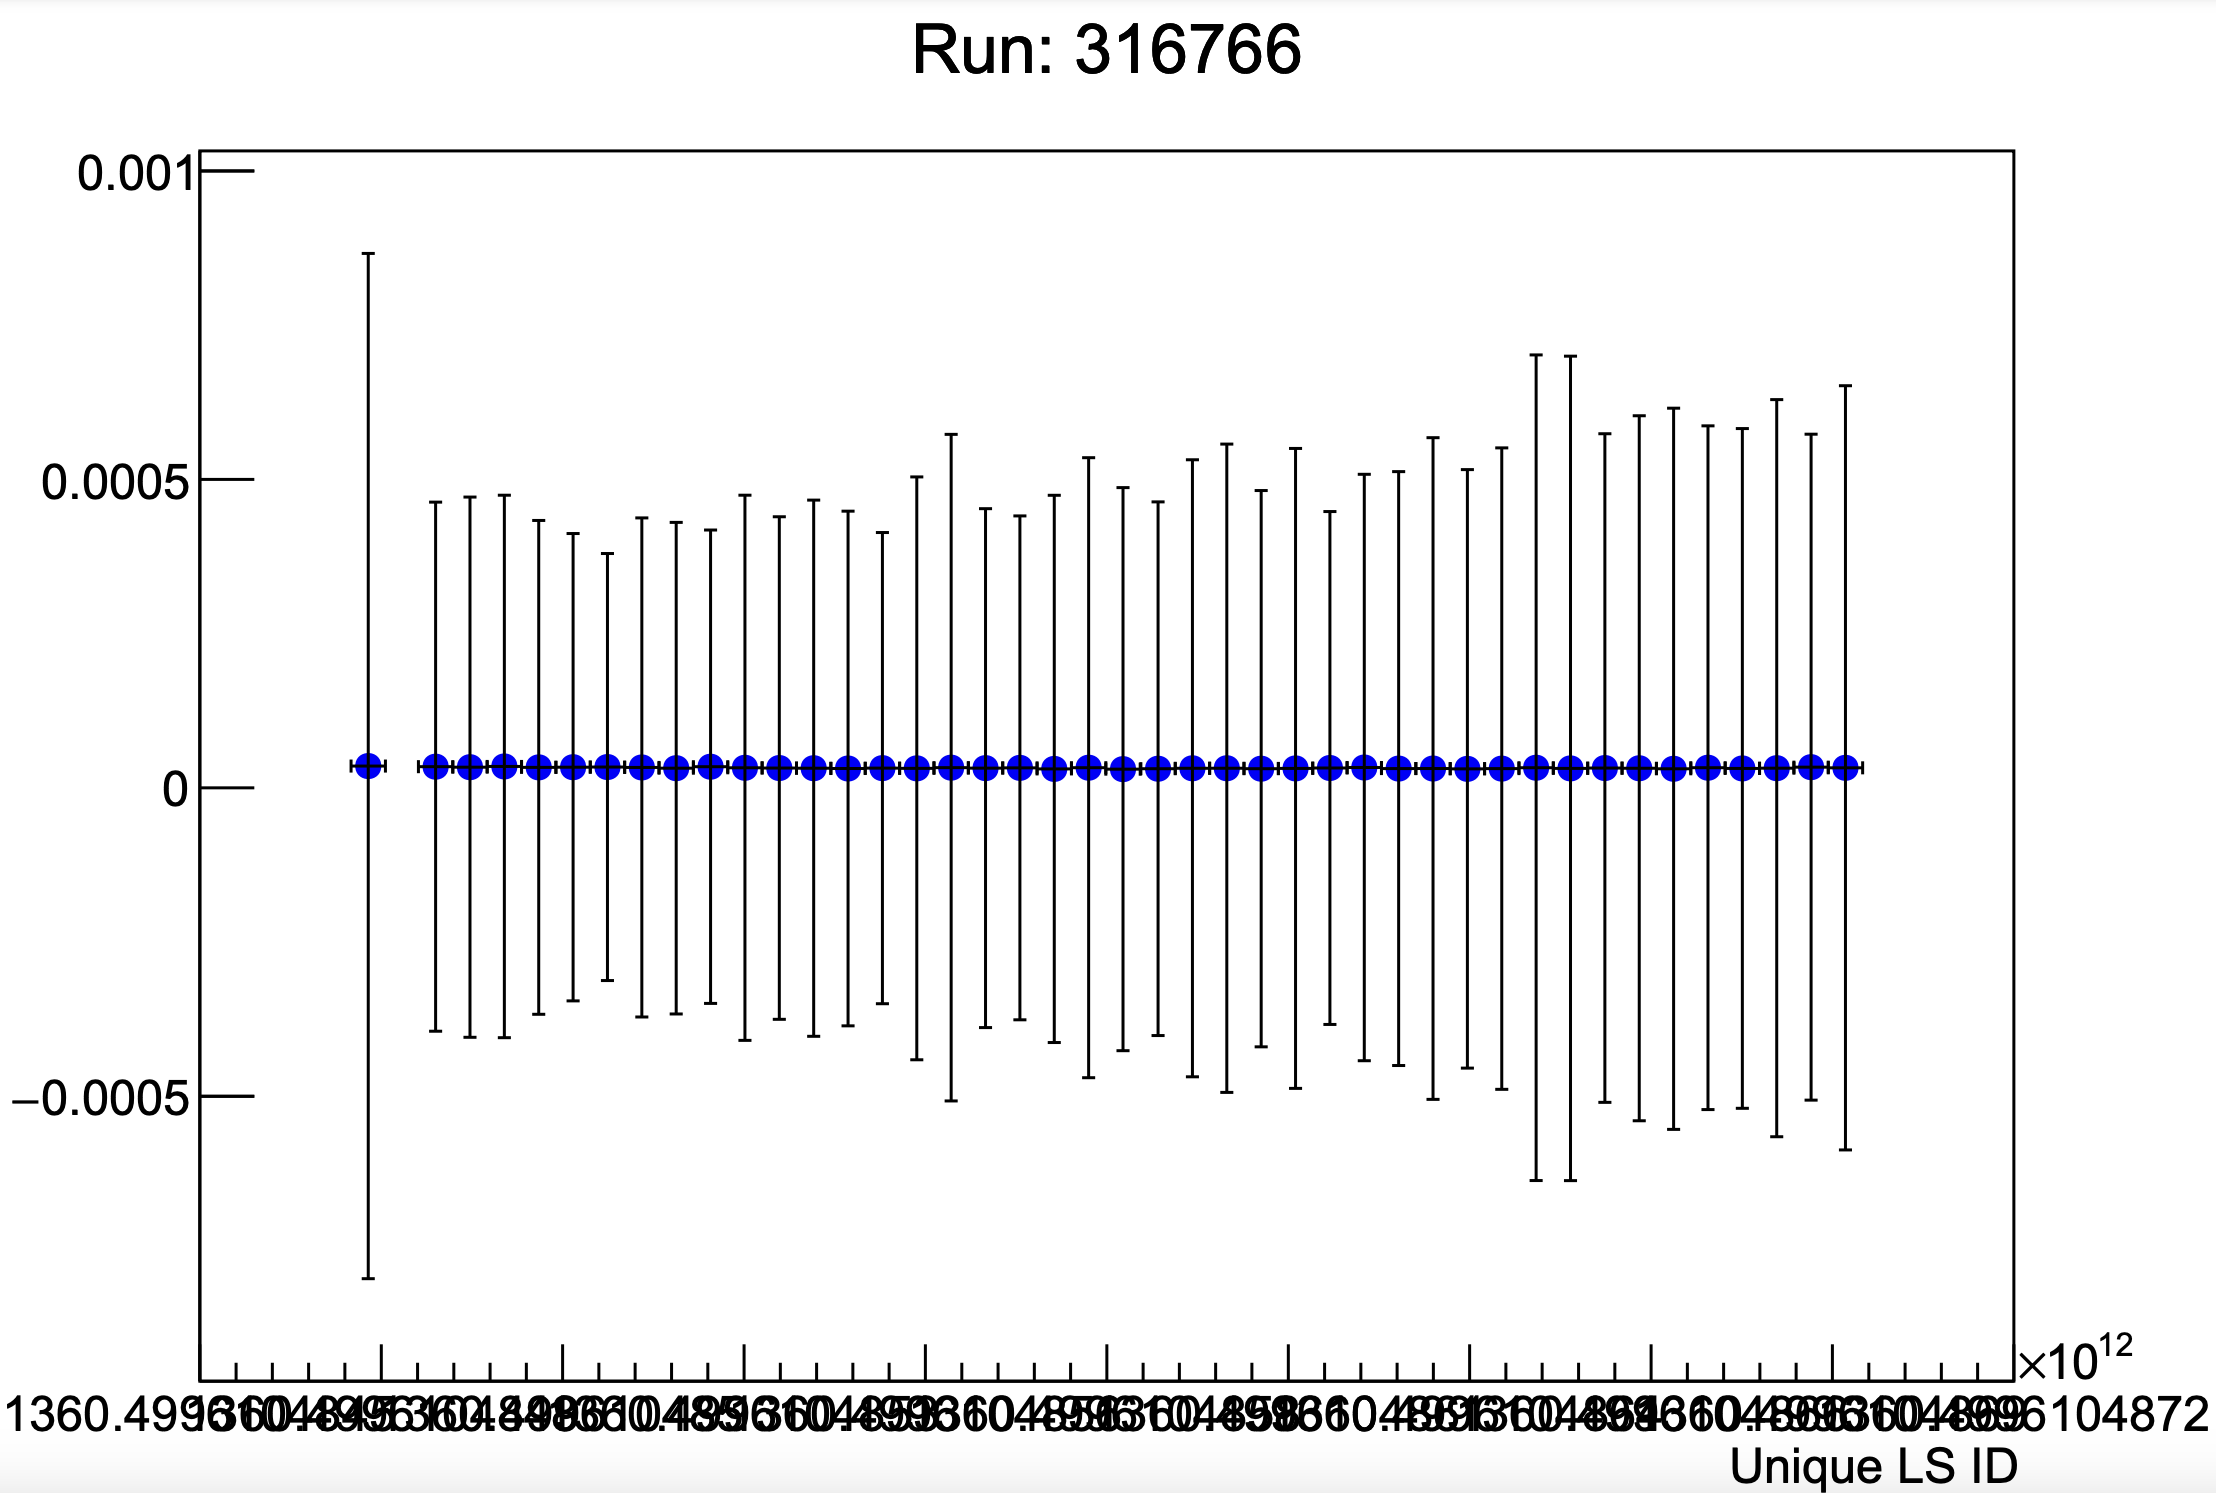
residual_type1->SetTitle(TString("Run: ")+run.at(i));
residual_type1->GetYaxis()->SetTitle("Type1 residual");
residual_type1->GetYaxis()->SetNdivisions(4);
residual_type1->GetXaxis()->SetTitle("Unique LS ID");
residual_type1->SetMarkerColor(4);
residual_type1->Draw("AP");
//C->Print(outpath+"/residualtype1_"+run.at(i)+".pdf");
}
residualvsinstlumi->GetYaxis()->SetTitle("Type1 residual");
residualvsinstlumi->GetYaxis()->SetNdivisions(4);
residualvsinstlumi->GetXaxis()->SetTitle("Inst. lumi");
residualvsinstlumi->SetMarkerColor(4);
//residualvsinstlumi->GetYaxis()->SetRangeUser(0.00002, 0.00005);
residualvsinstlumi->Draw("AP");
C->Print(outpath+"/residualtype1vsinstlumi_"+".pdf");
}
root [0]
Processing afterglow_residualvsLumi.C...
In file included from input_line_9:1:
/Users/couet/Downloads/afterglow_residualvsLumi.C:1:10: fatal error: 'globals.h' file not found
#include "globals.h"
         ^~~~~~~~~~~
root [1]
maybe just comment it out. I think code do not use it.
Missing one file:
Processing afterglow_residualvsLumi.C...
Error in <TFile::TFile>: file /316766.root does not exist
Please save this file somewhere and mention its path in the code.
316766.root (2.8 MB)
please let me know how to fill this graph with all bincontent_avg values. I think, there are 43 values in the root file.
Maybe bincontent_avg values need to be filled into an array first.
there is some issue with the for loops in the code.
You add points to your “residualvsinstlumi” graph always using the same “bincontent_avg”.
Yes can you please tell me what modification is required in the code to fill it with all values? Actually when I do cout << bincontent_avg, I see all values but those values are not getting filled in residualvsinstlumi graph.
thanks
Can you please elaborate? thanks!
I am already using SetPoint to fill this graph.
Problem is this graph is getting filled with only one bincontent_avg value but there are 43 values.
Can you please tell me how to debug this code?
Maybe some modification is required in loops or to use an array for bincontent_avg but I am not sure how to do it.
This would suggest you need 43 TGraph. If it is he case, you can put them in a TMultiGrpah and draw it. The 43 graphs will appear on the plot.
This strategy might not work as the actual size of run vector is very large and there are many more bincontent_avg values when I will run this code over entire run set.
Maybe doing something simple like filling bincontent_avg into an array and modifying the loops in the code might work but I don’t know how to do that.
I am not completely sure to understand the logic of your code. In principle a single TGraph is enough also … you can enter as many points as you want in a TGraph.
You plot first a histogram with option ‘HIST’, then many graphs with option “A” so they are plotted above the histogram which will disappear from the plot and each graph drawing will also erase the previous one… and at the end, you finally plot a final graph with option “A” so only this one will be visible … all the plots you did before are useless … that why the logic is a bit obscure to me.
yes that is the problem. Can you please let me know how to fix it and use all bincontent_avg values in the later part of the code to fill residualvsinstlumi graph?
As I said the way you draw things is confusing. You should clarify it because now only the last graph drawing is visible as you are using option “A” in all the Draw commands.
A TGraph is made of two vectors of X and Y values. You can fill them as you need with the SetPoint or AddPoint methods. It is up to you to decide what should be X and what should be Y. I am afraid I cannot help more.