Dear Experts,
I’m facing some strange issue, where my TGraphErrors drawn with option “L4” draws some very strange error bands. They look to me inverse or shifted. Unfortunately I couldn’t figure out why. My first guess was a negative error causing this behaviour but using an additional “abs()” to set the error didn’t solve the issue.
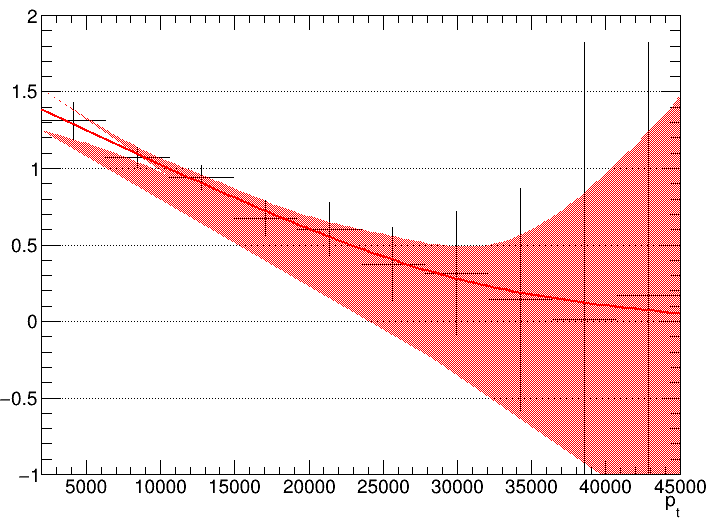
Here’s a screenshot of the behaviour:
I stripped down my script via commenting code to run as a macro and added a section where I set the options I’d normally pass via commandline. You just have to call “root graph.cxx” and it produced a “test_fit_reweightMC_01_wNone.pdf” in the folder you run it.
Ok using “L3” to draw the TGraphErrors the plot looks fine. So something sketchy must be happening when using “L4” which shall draw a smoothed filled area.
I see. You are facing the issue described here. The smoothing technique used when option “E4” is set may produce some artefacts. Yes, in your case, you should go to 3.