TGraphErrors draw option a2 not working

Dear experts,

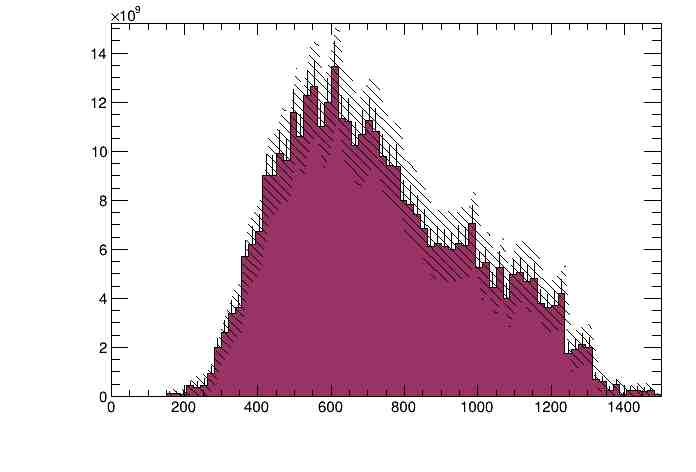
I am having an awkward problem plotting the errors with TGraphErrors , if i use option 3, the result is the one below:

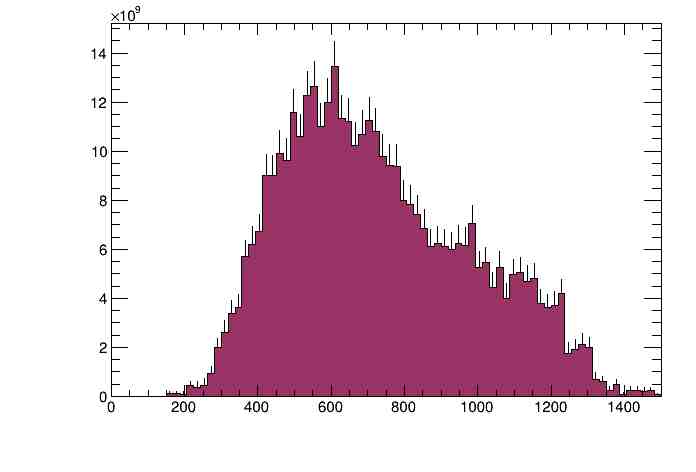
But if i change the option to 1,2 or 5 the errors simply disappear. In the image below is the plot with the option 2;

No more errors, as you can see. So i don’t know what could be happening. There is any other option that would reproduce the same results? I mean, would give me the rectangular error bars? like b instead of 2? I would like to try something like that, or any tips that you may have.

Below is a part of my code if you want to give a look at it:

			for jk in range(nHistograms):
				errorArray.append(  nameArray[jk] + 'error' ) 
                nEntries = ster[jk].GetNbinsX()
				xminn = ster[jk].GetXaxis().GetXmin()
				xmaxx = ster[jk].GetXaxis().GetXmax()
				width = ster[jk].GetXaxis().GetBinWidth(1)
				x = array('f')  #array['f']
				y = array('f') #array['f']
				ex = array('f') #array['f']
				ey =  array('f') #array['f']		
				for i in range(nEntries):
					x.append(xminn + width*i)   
					y.append(ster[jk].GetBinContent(i))
					ey.append(ster[jk].GetBinError(i) + ster[jk].GetBinError(i))
					ex.append(0.0)				
				errorArray[jk] = TGraphErrors(  nEntries, x, y, ex, ey )
				errorArray[jk].SetLineColorAlpha(0, 0)
				errorArray[jk].SetFillStyle(errostyleArray[jk])
				errorArray[jk].SetFillColor(errorfillArray[jk])

and for the plot:

> 
> for j in range(nHistograms):
>    ax1.plot(errorArray[j],"2")

For the .plot() option, i am actually using Atlas Plots. But it’s equivalent to errorArray[j].Draw(“a2”).

Best Regards,
Caio Daumann.

Can you save the canvas as a C macro and post it here ?

HI @couet, i am posting a part of my code, if you want me to post in a way you can run it, let me know please. And i used pyrrot btw, is that ok? I never used it in c++.

	canvas = root.TCanvas( " canvas " )
	canvas.cd()
	canvas.Print( " plots . png [ " )

	#ster[3].Draw("h")
	ster[3].SetLineColor(1)
	ster[3].Draw("h")
	errorArray[3].SetFillColor(1)
	errorArray[3].SetFillStyle(3345)
	errorArray[3].Draw("3")


	canvas.Print( " plots.jpg  " )

where ster[] is an array that keeps my histograms, and errorArray[] is an array that keeps the Tgrapherros for these hhistograms.

Drawing the errors with option 3:

and for option 2:

He is asking you to execute canvas.SaveAs("canvas.cxx") or canvas.Print("canvas.cxx")

2 Likes

Yes sorry I was not clear enough …

1 Like

There you go

canvas.cxx (12.7 KB)

This macro (and very likely the original code) specifies the TGraphErrors line color as white. And therefore it is not visible:

   ci = 1318;
   color = new TColor(ci, 1, 1, 1, " ", 0);
   gre->SetLineColor(ci);

Remove these lines and the error bars will show.

1 Like

But why would it be able to plot the errors with “3” and not with option “2”, If the line colors were the same?
I changed the line color to black, they were indeed white, but the result is the same as before. I read the canvas.cxx file and the lines you told me to remove were not there anymore too.

canvas.cxx (12.7 KB)

Well i found my mistake, i set the ex as 0. And then obviously there was no error bar.

This topic was automatically closed 14 days after the last reply. New replies are no longer allowed.