TLegend *DrawLegend(Double_t x1,Double_t y1,Double_t x2,Double_t y2)
{
TLegend *legend = new TLegend(x1,y1,x2,y2);
legend->SetTextFont(42);
legend->SetFillColor(0);
legend->SetTextSize(0.035);
legend->SetLineColor(0);
legend->SetShadowColor(0);
//legend->AddEntry(gr1,"(0 - 100) %","p");
return legend;
}
void dNdY_Lambda()
{
gStyle->SetOptTitle(0);
gStyle->SetOptStat(0);
gStyle->SetOptFit(1111);
gStyle->SetStatColor(0);
gStyle->SetCanvasColor(0);
gStyle->SetPadColor(0);
gStyle->SetPadBorderMode(0);
gStyle->SetCanvasBorderMode(0);
gStyle->SetFrameBorderMode(0);
gStyle->SetFillColor(0);
gStyle->SetLineColor(1);
gStyle->SetTitleTextColor(1);
gStyle->SetTitleColor(1);
Double_t dNchdeta[4] ={7.1,16.1,23.2,35.68};
Double_t dNchdetaError[4] ={0.2,0.4,0.54,0.8};
Double_t dNdy[4] ={0.018,0.044,0.065,0.099};
Double_t dNdyStatError[4] ={0.001,0.002,0.002,0.004};
Double_t dNdySysError[4] ={0.002,0.005,0.007,0.011};
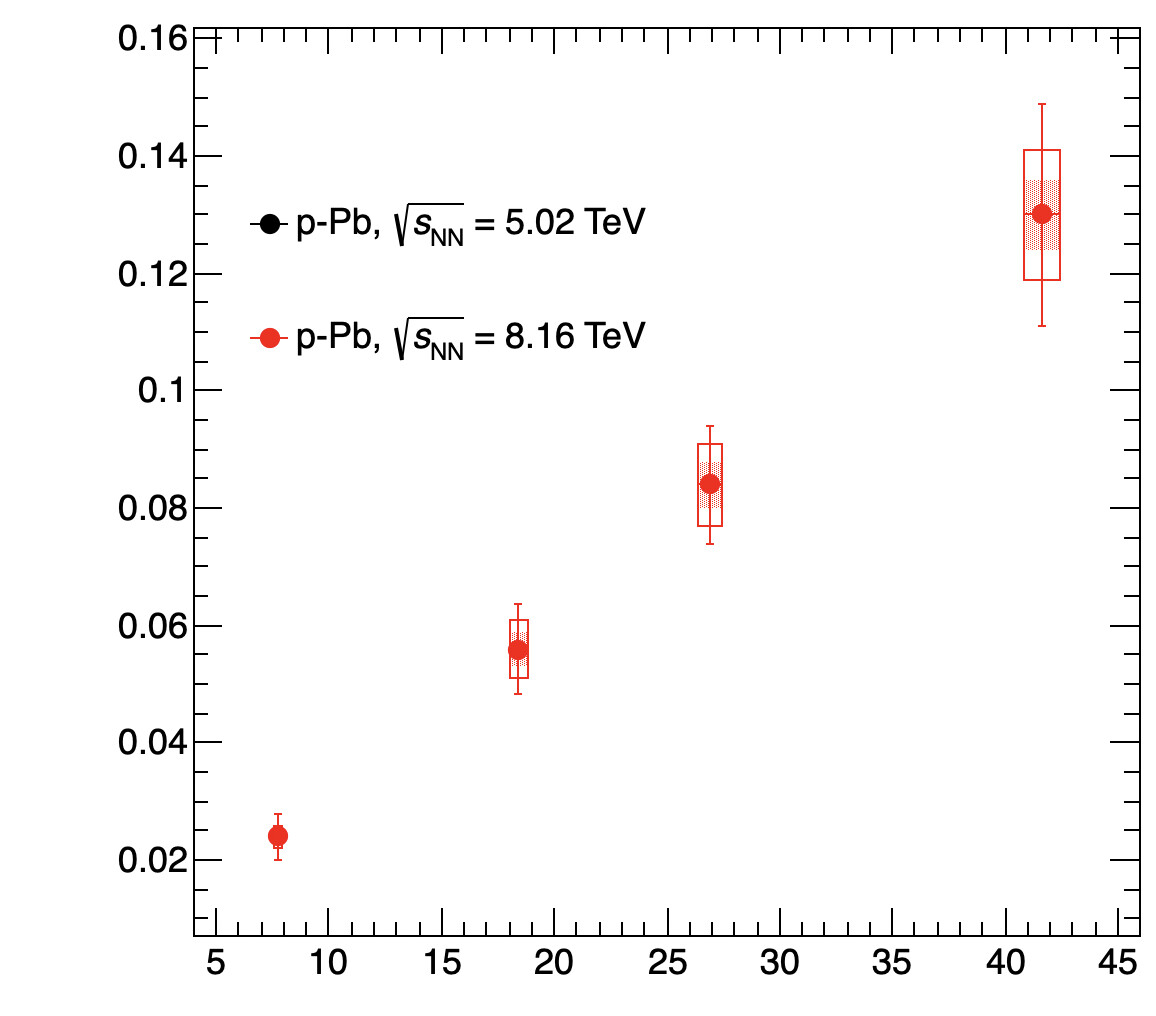
Double_t dNchdeta8[4] ={7.72,18.39,26.89,41.65};
Double_t dNchdetaError8[4] ={0.21,0.48,0.7,0.8};
Double_t dNdy8[4] ={0.024,0.056,0.084,0.13};
Double_t dNdyStatError8[4] ={0.001,0.0030,0.004,0.006};
Double_t dNdySysError8[4] ={0.004,0.0076,0.01,0.019};
Double_t dNdySysUncorError8[4] ={0.002,0.005,0.007,0.011};
Double_t Meanpt[4] ={1.405,1.475,1.607,1.675};
Double_t MeanptStatError[4] ={0.093,0.034,0.032,0.036};
Double_t MeanptSysError[4] ={0.074,0.037,0.043,0.04};
Double_t Meanpt8[4] ={1.42,1.6,1.71,1.8};
Double_t MeanptStatError8[4] ={0.038,0.048,0.047,0.043};
Double_t MeanptSysError8[4] ={0.063,0.067,0.076,0.08};
Double_t MeanptSysUncorError8[4] ={0.03,0.04,0.047,0.046};
TGraphErrors *grstat = new TGraphErrors(4,dNchdeta,dNdy,dNchdetaError,dNdyStatError);
grstat->SetMarkerColor(1);
grstat->SetMarkerStyle(20);
grstat->SetLineColor(1);
grstat->SetMarkerSize(1.2);
TGraphErrors *grsys = new TGraphErrors(4,dNchdeta,dNdy,dNchdetaError,dNdySysError);
grsys->SetMarkerColor(1);
grsys->SetMarkerStyle(20);
grsys->SetLineColor(1);
grsys->SetMarkerSize(1.2);
grsys->SetFillColor(1);
grsys->SetFillStyle(0);
TGraphErrors *grstat8 = new TGraphErrors(4,dNchdeta8,dNdy8,dNchdetaError,dNdyStatError8);
grstat8->SetFillColor(kRed);
grstat8->SetFillStyle(3002);
TGraphErrors *grsys8 = new TGraphErrors(4,dNchdeta8,dNdy8,dNchdetaError,dNdySysError8);
grsys8->SetMarkerColor(kRed);
grsys8->SetMarkerStyle(20);
grsys8->SetLineColor(kRed);
grsys8->SetMarkerSize(1.2);
TGraphErrors *grsysuncor8 = new TGraphErrors(4,dNchdeta8,dNdy8,dNchdetaError,dNdySysUncorError8);
grsysuncor8->SetFillStyle(0);
grsysuncor8->SetLineColor(kRed);
TGraphErrors *grMeanstat = new TGraphErrors(4,dNchdeta,Meanpt,dNchdetaError,MeanptStatError);
TGraphErrors *grMeansys = new TGraphErrors(4,dNchdeta,Meanpt,dNchdetaError,MeanptSysError);
TGraphErrors *grMeanstat8 = new TGraphErrors(4,dNchdeta8,Meanpt8,dNchdetaError8,MeanptStatError8);
TGraphErrors *grMeansys8 = new TGraphErrors(4,dNchdeta8,Meanpt8,dNchdetaError8,MeanptSysError8);
TGraphErrors *grMeansysuncor8 = new TGraphErrors(4,dNchdeta8,Meanpt8,dNchdetaError8,MeanptSysUncorError8);
grstat8->GetXaxis()->SetTitle("<dN_{ch}/d#eta >_{|#eta| < 0.5}");
grstat8->GetXaxis()->CenterTitle(true);
grstat8->GetXaxis()->SetLabelFont(42);
grstat8->GetXaxis()->SetLabelSize(0.035);
grstat8->GetXaxis()->SetTitleSize(0.04);
grstat8->GetXaxis()->SetTitleOffset(1.1);
grstat8->GetXaxis()->SetTitleFont(42);
grstat8->GetYaxis()->SetTitle("dN/dy");
grstat8->GetYaxis()->CenterTitle(true);
grstat8->GetYaxis()->SetLabelFont(42);
grstat8->GetYaxis()->SetLabelSize(0.035);
grstat8->GetYaxis()->SetTitleSize(0.05);
grstat8->GetYaxis()->SetTitleOffset(1.3);
grstat8->GetYaxis()->SetTitleFont(42);
grstat8->GetHistogram()->SetMaximum(0.18);
grstat8->GetHistogram()->SetMinimum(0);
TCanvas *cdNdY_2 = new TCanvas("cdNdY_2","cdNdY_2",100,100,600,600);
cdNdY_2->cd();
cdNdY_2->SetLeftMargin(0.18);
cdNdY_2->SetRightMargin(0.03);
cdNdY_2->SetTopMargin(0.03);
cdNdY_2->SetBottomMargin(0.18);
cdNdY_2->SetTicks(1,1);
grsys8->Draw("AP");
grstat8->Draw("2");
grsysuncor8->Draw("2");
TLegend *llp1 = DrawLegend(0.22,0.65,0.4,0.85);
llp1->AddEntry(grsys,"p-Pb, #sqrt{#it{s}_{NN}} = 5.02 TeV ","lp");
llp1->AddEntry(grsys8,"p-Pb, #sqrt{#it{s}_{NN}} = 8.16 TeV ","lp");
llp1->Draw();
float lx=10.0;float ly=0.79;
TLatex* tt31=new TLatex(10,0.5,"#Lambda*^{0}");
tt31->SetTextFont(42);
tt31->SetTextAlign(13);
tt31->SetTextSize(0.08);
tt31->Draw();
}