Hello,
I am plotting a TMultigraph which contains 4 objects
1)Tick Blue Line with Marker --> TGraph
2)Tick Red Line with Marker --> TGraph
3)Thin Blue Line without Marker --> TGraph
4)Green band shows the error of 3) --> TGraphErrors
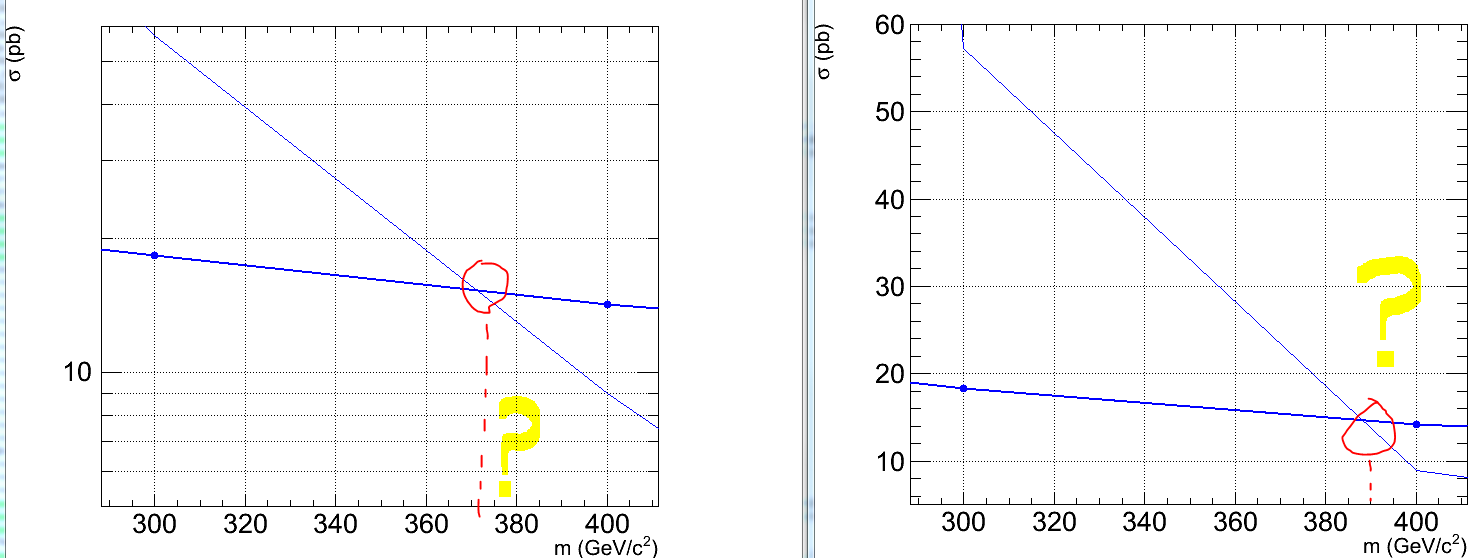
Then I compute using the Eval method, the intersection between the Thick Blue line and the lower edge of the green band (It is the Thin blue line - 15% Error). If I do this, I find an intersection point of 382GeV/c².
Note, that Eval is used as a linear interpolator (no spline used here)
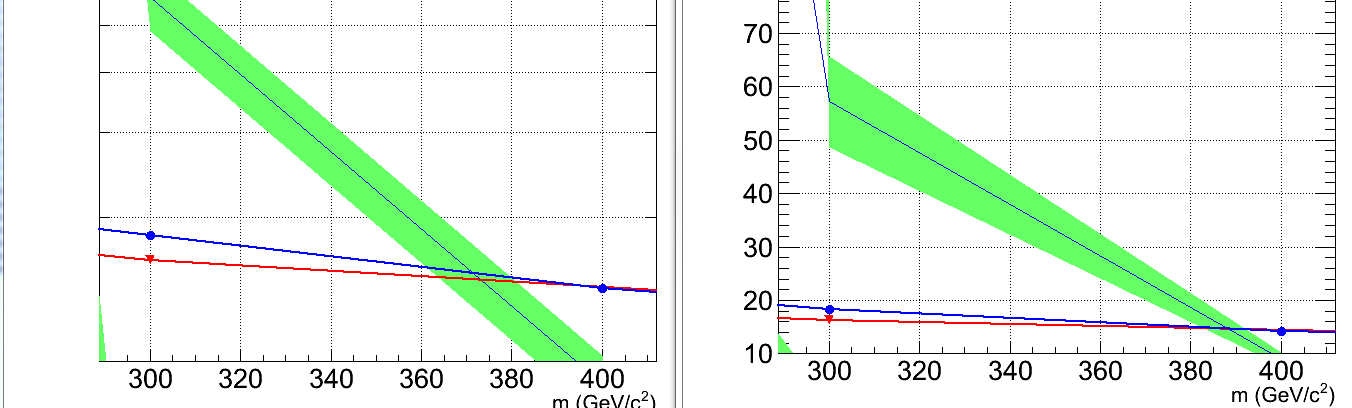
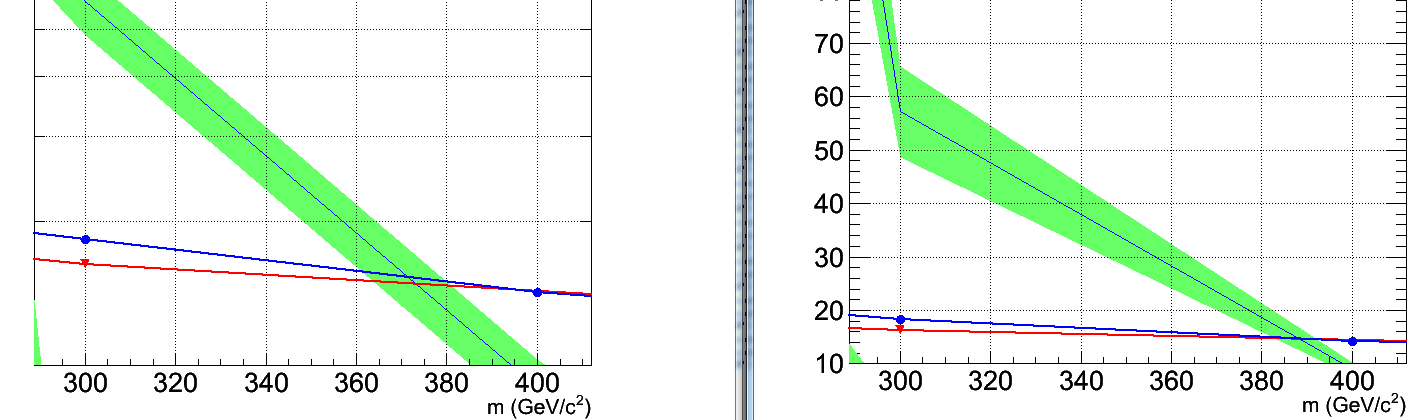
Then I’ve plotted the TMultigraph both in log and in linear scale.
As you can see it, the displayed intersection point in the log scale (left of the attachement) is obviously incompatible with the previous computation. In the linear scale plot, everything seem to be Ok.
However, I absolutely need the log scale version of this plot (since I need to add more line on it that have different y scale).
Can you please advice me on how to solve this problem…
I am using ROOT5.22/00d and can hardly use an other version, since I’d like to tick to the CMSSW root version.