Hi Rene,
I found the problem. What happens is that the merging of two graphs does not pass along the errors.
Here are simple scripts to illustrate the issue.
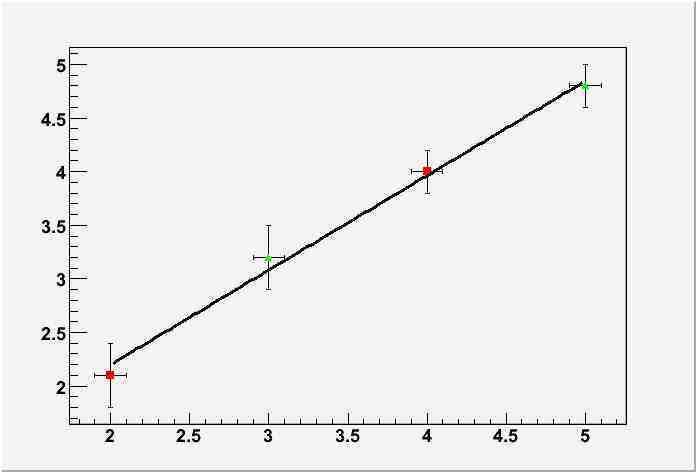
{
  // four points are drawn and fit.

  Double_t x[4] = {2.,3.,4.,5.};
  Double_t dx[4] = {0.1,0.1,0.1,0.1};
  Double_t y[4] = {2.1,3.2,4.0,4.8};
  Double_t dy[4] = {0.1,0.3,0.2,0.2};

  gStyle->SetOptFit(111);

  TGraphErrors *g = new TGraphErrors(4,x,y,dx,dy);
  g->SetMarkerStyle(21);
  g->Draw("AP");
  g->Fit("pol1");
}
Change dy[0] to 0.3 and voila, the weight in the fit is changed.
{
  // four points are drawn and fit.
  // dy[0] changed to 0.3

  Double_t x[4] = {2.,3.,4.,5.};
  Double_t dx[4] = {0.1,0.1,0.1,0.1};
  Double_t y[4] = {2.1,3.2,4.0,4.8};
  Double_t dy[4] = {0.3,0.3,0.2,0.2};

  gStyle->SetOptFit(111);

  TGraphErrors *g = new TGraphErrors(4,x,y,dx,dy);
  g->SetMarkerStyle(21);
  g->Draw("AP");
  g->Fit("pol1");
}
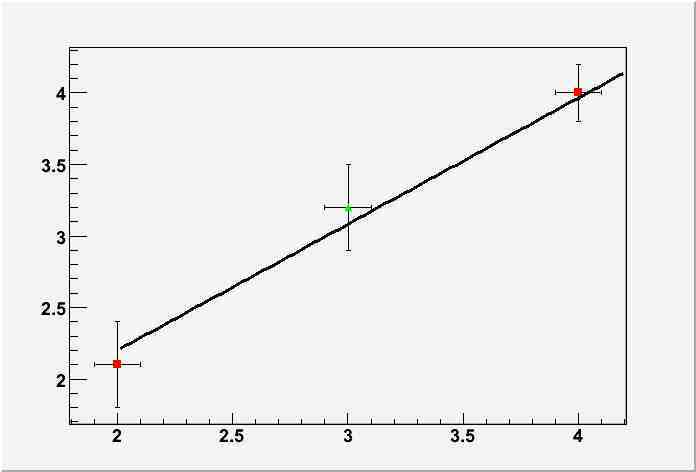
Now the issue.
I split the points in two sets of arrays, then merge the graphs to fit all points. It seems the merging does not pass along the errors, just the points. Hence, a fit is done with calculated weights, as if option “W” or “WW” was given.
{
  Double_t x1[2] = {2.,4.};
  Double_t dx1[2] = {0.1,0.1};
  Double_t y1[2] = {2.1,4.0};
  Double_t dy1[2] = {0.3,0.2};

  Double_t x2[2] = {3.,5.};
  Double_t dx2[2] = {0.1,0.1};
  Double_t y2[2] = {3.2,4.8};
  Double_t dy2[2] = {0.3,0.2};

  gStyle->SetOptFit(0001);

  TGraphErrors *g1 = new TGraphErrors(2,x1,y1,dx1,dy1);
  g1->SetMarkerStyle(21);
  g1->SetMarkerColor(2);

  TGraphErrors *g2 = new TGraphErrors(2,x2,y2,dx2,dy2);
  g2->SetMarkerStyle(22);
  g2->SetMarkerColor(3);

  TList *myList = new TList();
  myList->Add(g1);
  myList->Add(g2);

  TGraphErrors *g = new TGraphErrors();
  g->Merge(myList);

  g->Draw("AP");
  g->Fit("pol1","F");

  g1->Draw("P same");
  g2->Draw("P same");

}
 .
.