Mansi
November 22, 2021, 7:40am
1
Hello,
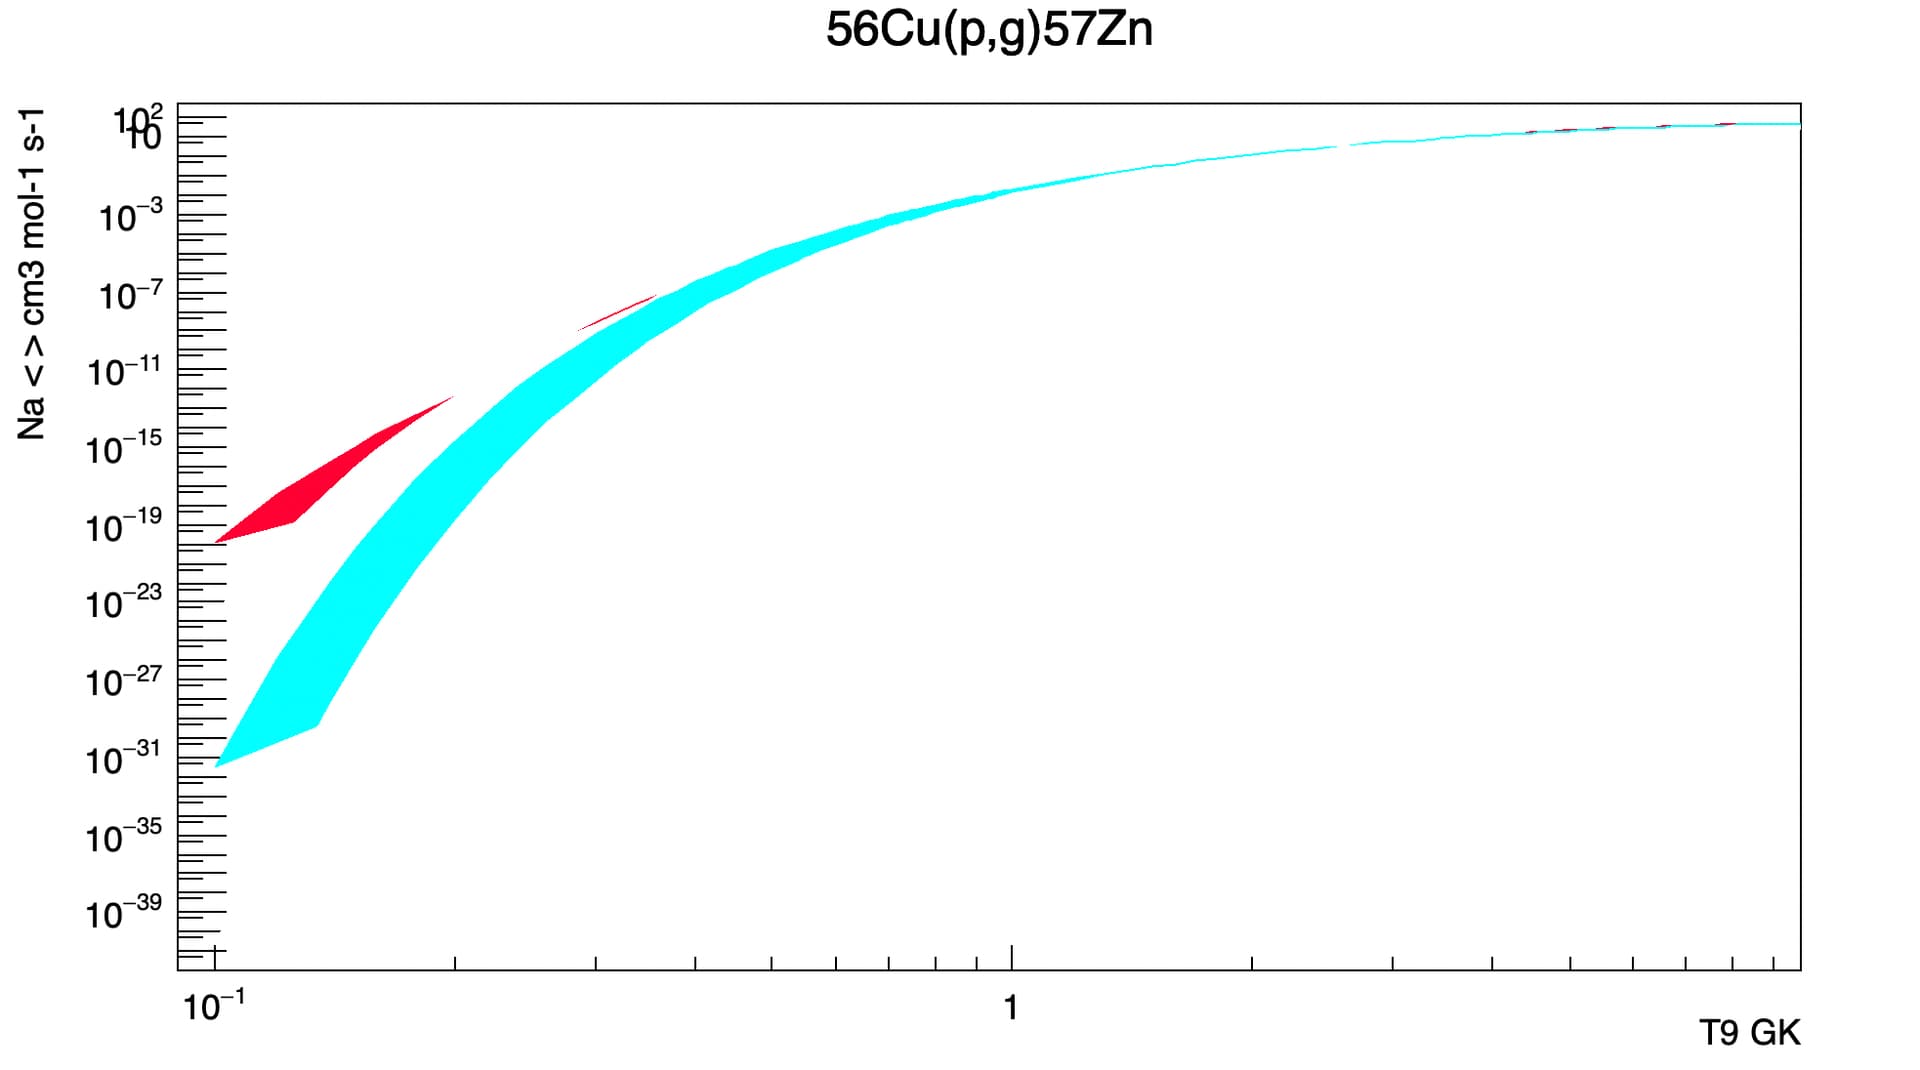
I have a reaction rate plot (reaction rate vs temperature). It has been plotted for different Q values, leading to different lines. I have attached the example.
I would like to fill the gap between the two lines - so it looks like a band.
How to do this ?
Thanks56Cupg.pdf (77.6 KB)
Please read tips for efficient and successful posting and posting code
ROOT Version: 6.18Platform: Mac OS Big SurCompiler: Not Provided
couet
November 22, 2021, 8:10am
2
One way will be to draw the highest graph filled with some color and then the lower one filled with white color.
Mansi
November 22, 2021, 10:48am
3
I had defined a TMultiGraph -
TMultiGraph *mg = new TMultiGraph();
  mg->SetTitle("56Cu(p,g)57Zn");
  mg->GetYaxis()->SetTitle("Na < > cm3 mol-1 s-1");
  mg->GetXaxis()->SetTitle("T9 GK");
  mg->GetYaxis()->CenterTitle();
  mg->GetXaxis()->CenterTitle();
  mg->GetXaxis()->SetTitle("T9 GK");


TGraph *to_rate = new TGraph(n_tem, t, total_rate);

 to_rate->SetTitle("REACLIB FITTING");
 to_rate->SetMarkerStyle(21);
 to_rate->SetMarkerColor(4);
 to_rate->SetLineColor(4);
 to_rate->SetLineWidth(2);
 to_rate->GetYaxis()->SetTitle("Na < > cm3 mol-1 s-1");
 to_rate->GetXaxis()->SetTitle("T9 GK");


 TGraph *to_rate_up = new TGraph(n_tem, t, total_rate_up);

 to_rate_up->SetMarkerStyle(21);
 to_rate_up->SetMarkerColor(kPink);
 to_rate_up->SetLineColor(kPink);
 to_rate_up->SetLineWidth(2);
 // to_rate_up->SetFillStyle(3001);
 // to_rate_up->SetLineStyle(4);
 to_rate_up->GetYaxis()->SetTitle("Na < > cm3 mol-1 s-1");
 to_rate_up->GetXaxis()->SetTitle("T9 GK");

 TGraph *to_rate_dn = new TGraph(n_tem, t, total_rate_dn);

 to_rate_dn->SetTitle("REACLIB FITTING");
 to_rate_dn->SetMarkerStyle(21);
 to_rate_dn->SetMarkerColor(4);
 to_rate_dn->SetLineColor(kPink);
 to_rate_dn->SetLineStyle(4);
 to_rate_dn->SetLineWidth(2);
 to_rate_dn->GetYaxis()->SetTitle("Na < > cm3 mol-1 s-1");
 to_rate_dn->GetXaxis()->SetTitle("T9 GK");
mg->Add(to_rate_up);
 mg->Add(to_rate_dn);
 mg->Draw("al");
How to fill individual graphs in such a case ?
Thanks
couet
November 22, 2021, 11:42am
4
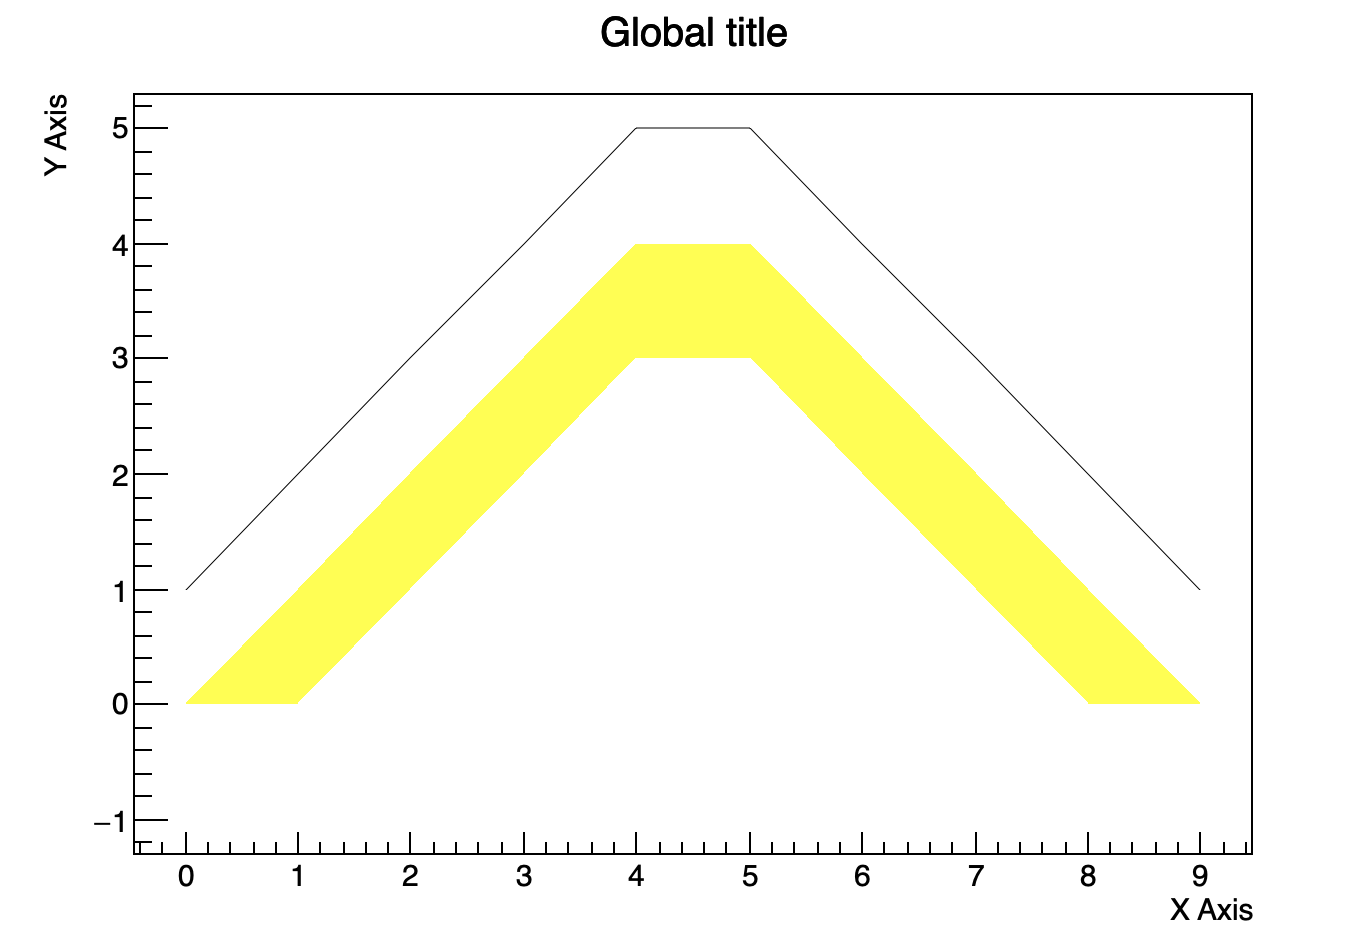
{
   Double_t x[10] = {0,1,2,3,4,5,6,7,8,9};
   Double_t y[10] = {1,2,3,4,5,5,4,3,2,1};
   TMultiGraph *mg = new TMultiGraph();


   auto g1 = new TGraph(10, x, y);
   mg->Add(g1);

   for (int j=0; j<10; j++) y[j] = y[j]-1;
   auto g2 = new TGraph(10, x, y);
   g2->SetFillColor(kYellow);
   mg->Add(g2, "F");

   for (int j=0; j<10; j++) y[j] = y[j]-1;
   auto g3 = new TGraph(10, x, y);
   mg->Add(g3,"F");

   mg->Draw("AL");
   mg->SetTitle("Global title; X Axis; Y Axis");
}
Mansi
November 22, 2021, 12:16pm
5
Thanks.
But I have a problem. I have attached the plot. Since I plot multiple overlapping bands in the same graph, and I’m using white fill colour, some parts of the band are not visible.
Also how to avoid the sharp cut off at the edges?
TGraph *to_rate_up = new TGraph(n_tem, t, total_rate_up);

 to_rate_up->SetMarkerStyle(21);
 to_rate_up->SetMarkerColor(kPink);
 to_rate_up->SetLineColor(kPink);
 to_rate_up->SetFillColor(kPink);
 to_rate_up->SetLineWidth(2);

 // to_rate_up->SetFillStyle(3001);
 // to_rate_up->SetLineStyle(4);
 to_rate_up->GetYaxis()->SetTitle("Na < > cm3 mol-1 s-1");
 to_rate_up->GetXaxis()->SetTitle("T9 GK");

 TGraph *to_rate_dn = new TGraph(n_tem, t, total_rate_dn);

 to_rate_dn->SetTitle("REACLIB FITTING");
 to_rate_dn->SetMarkerStyle(21);
 to_rate_dn->SetMarkerColor(4);
 to_rate_dn->SetLineColor(kPink);
 // to_rate_dn->SetLineStyle(4);
 to_rate_dn->SetLineWidth(2);
 to_rate_dn->GetYaxis()->SetTitle("Na < > cm3 mol-1 s-1");
 to_rate_dn->GetXaxis()->SetTitle("T9 GK");

 TGraph *to_rate_2011_dn = new TGraph(n_tem, t, total_rate_2011_dn);
 to_rate_2011_dn->SetLineColor(kBlue);
  to_rate_2011_dn->SetLineStyle(3);
  to_rate_2011_dn->SetLineWidth(2);

 TGraph *to_rate_2011_up = new TGraph(n_tem, t, total_rate_2011_up);
 to_rate_2011_up->SetLineColor(kBlue);
 to_rate_2011_up->SetFillColor(kCyan);
 to_rate_2011_up->SetLineStyle(3);
to_rate_2011_up->SetLineWidth(2);

 mg->Add(to_rate_up,"F");
 mg->Add(to_rate_dn,"F");

 mg->Add(to_rate_2011_up,"F");
 mg->Add(to_rate_2011_dn,"F");
couet
November 22, 2021, 12:50pm
6
You need to close the graphs properly.
Mansi
November 23, 2021, 4:14am
7
Thanks,
Mansi
couet
November 23, 2021, 1:46pm
8
The option “F” (to draw a filled graph) automatically close the graph from the last point to the first point in order to define a closed polygon (otherwise it is not possible to fill it). You need to have this in mind to understand how the filled polygon corresponding to your graphs are drawn. Take the example I send you and will understand. In the example I send you the last and first point of each graphs have the same Y value. Therefore the polygon is closed by an horizontal line between the first and the last point.