TGrapherror, can't get error bar

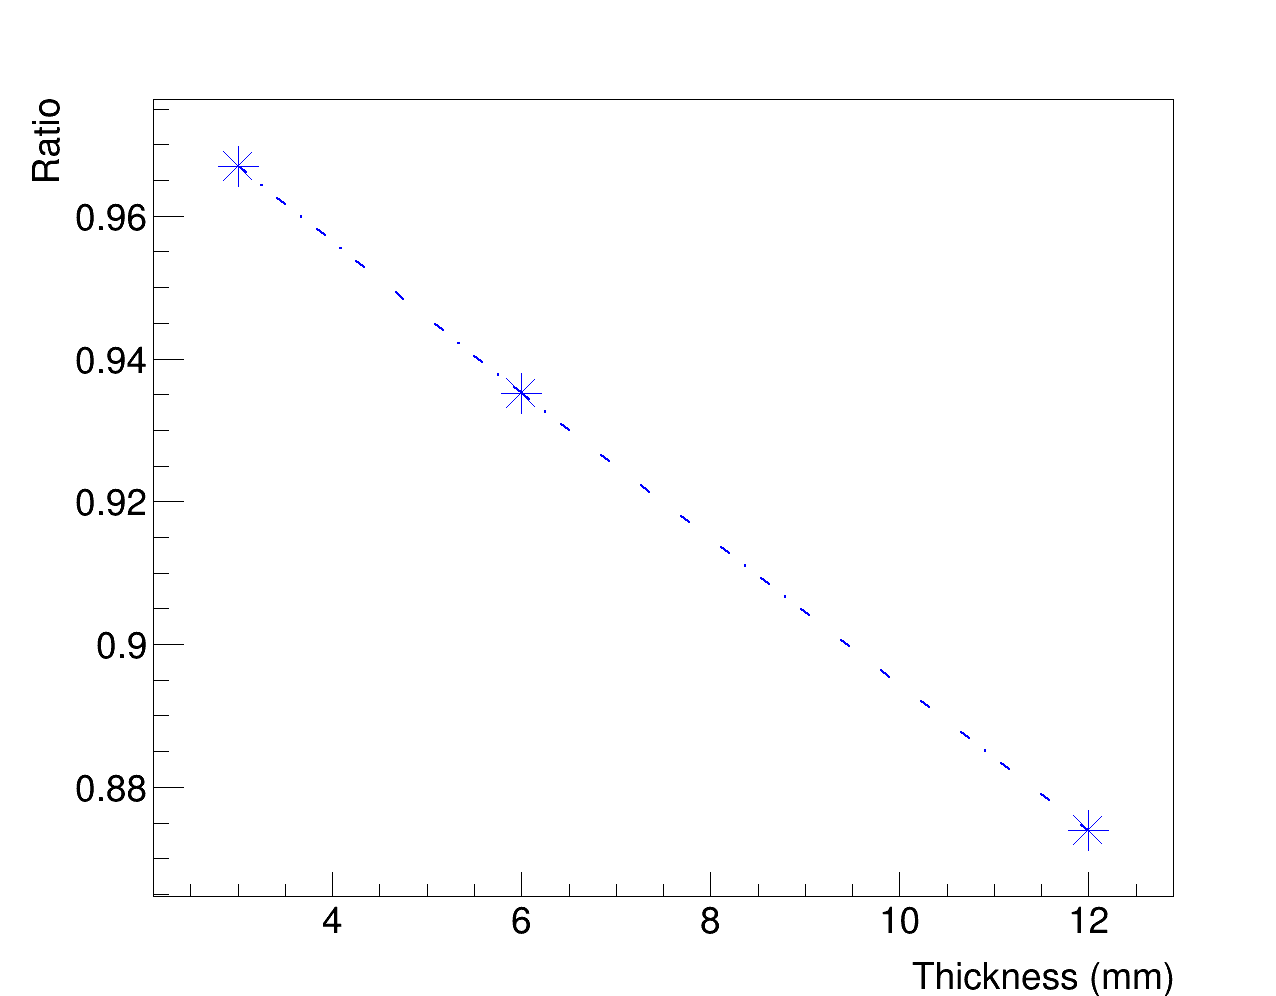
Hello, I’m plotting a TGrapherror, but I can’t get the error bars…

I wrote fakes high error to be sure that the real errors weren’t little the they couldn’t be seen…but you see…even if I wrote fake high errors, they aren’t drawn

posratio.cpp (2.0 KB)
Pos_ratio_number_Be.txt (67 Bytes)


Please read tips for efficient and successful posting and posting code

ROOT Version: Not Provided
Platform: Not Provided
Compiler: Not Provided


   TGraphErrors *graph1 = new TGraphErrors(datain,"%lg %lg %lg");

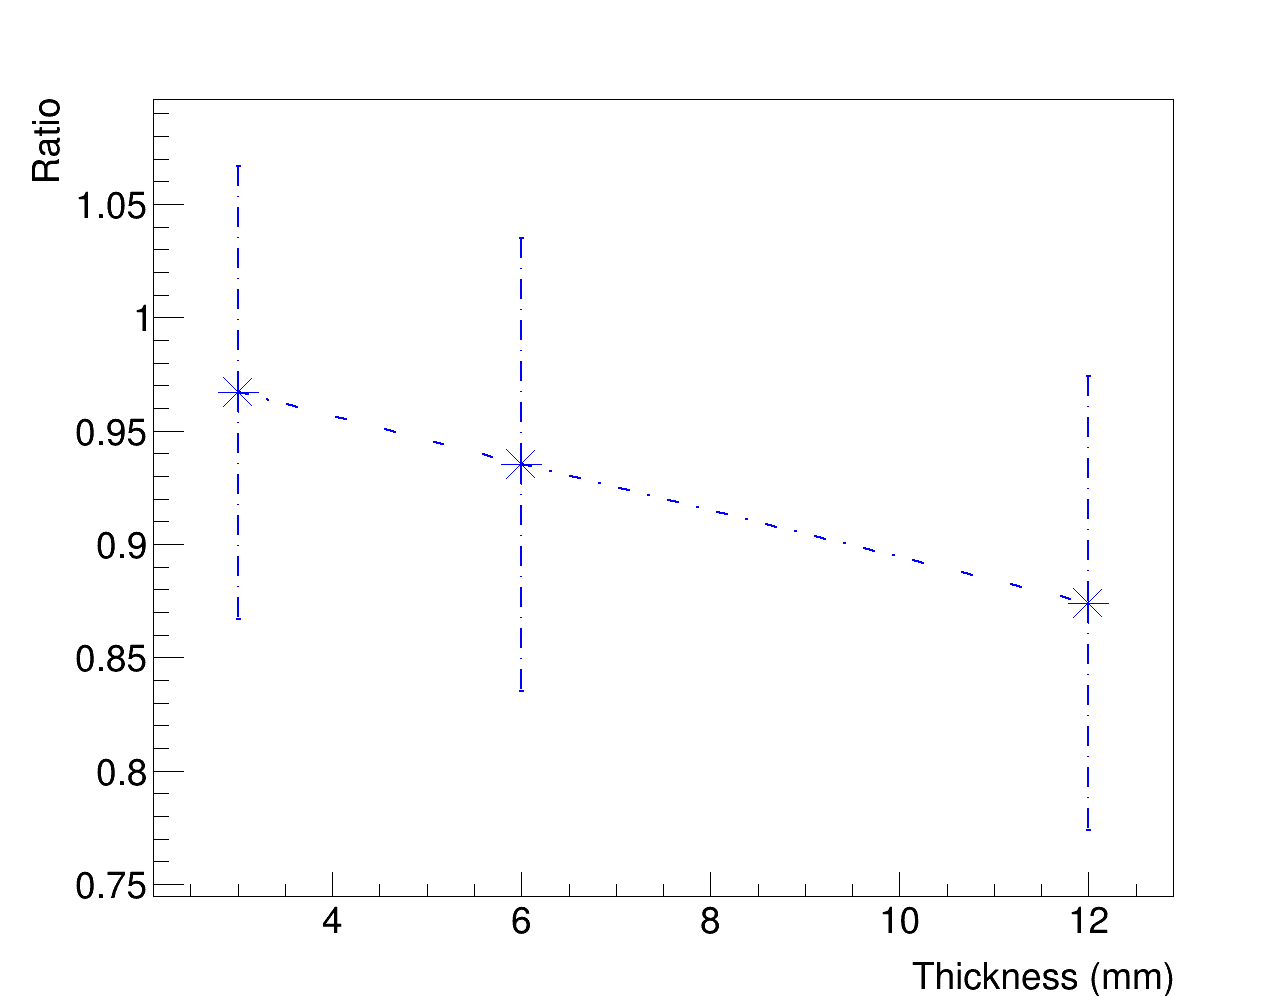
Thank you @couet …I was thinking that the third column was the x-error and the fourth the y-errorr…then I wrote the “0”…

One more question please…now both the error bars and the line between the point are dotted…is it possible to have the error bar as solid line and only the one between the point dotted?

void posratio() {
   gStyle->SetOptFit(0); //no print stat
   const char *datain = "Pos_ratio_number_Be.txt";
   TCanvas *c01 = new TCanvas("c01","graph",1280,1024);
   float offx=1.3;
   float offy=1.3;
   float margr=0.08;
   float w=3;
   float margl=0.12;
   float line=2;
   gPad->SetLeftMargin(margl);
   gPad->SetRightMargin(margr);
   TGraphErrors *graph1 = new TGraphErrors(datain,"%lg %lg %lg");
   graph1->SetMarkerColor(kBlue);
   graph1->SetMarkerStyle(3);
   graph1->SetLineColor(kBlue);
   graph1->SetMarkerSize(1.3);
   graph1->SetLineWidth(line);

   graph1->SetTitle();
   graph1->GetXaxis()->SetTitle("Thickness (mm)");
   graph1->GetYaxis()->SetTitle("Ratio");
   graph1->GetYaxis()->SetTitleOffset(offy);
   graph1->GetXaxis()->SetTitleOffset(offx);
   graph1->GetYaxis()->SetTitleSize(40);
   graph1->GetYaxis()->SetTitleFont(43);
   graph1->GetYaxis()->SetLabelFont(43);
   graph1->GetYaxis()->SetLabelSize(40);
   graph1->GetXaxis()->SetTitleSize(40);
   graph1->GetXaxis()->SetTitleFont(43);
   graph1->GetXaxis()->SetLabelFont(43);
   graph1->GetXaxis()->SetLabelSize(40);
   graph1->SetMarkerSize(5);

   auto graph2 = (TGraph*)graph1->Clone();
   graph2->SetLineColor(kBlue);
   graph2->SetLineWidth(line);
   graph2->SetLineStyle(10);
   graph2->Draw("AL");

   graph1->Draw("P");
}

Thank you @couet it works!

This topic was automatically closed 14 days after the last reply. New replies are no longer allowed.