Hi all,
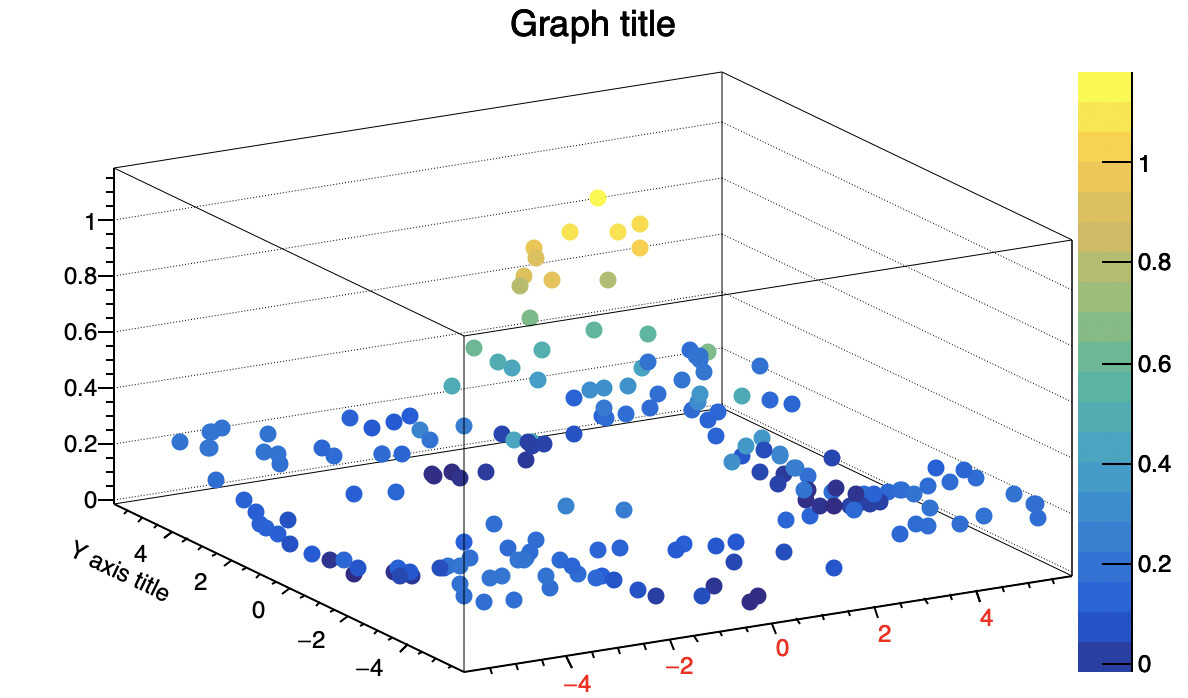
I’m working with a TGraph2DErrors and the idea is to use the Z-axis just for the PCOL option. So I’m performing a rotation, but the axis labels and ticks are not behaving has I would expect (depending on the rotation angles Theta and Phi): on the right margin (instead of on the left), on the inner side of the plot or shifted with respect to the origin, overlapping axis title and labels.
The following code produces the image in attachment:
TGraph2DErrors* G2DErr = new TGraph2DErrors(n_points_red);
G2DErr->SetTitle("Plot title; X-axis; Y-axis; Z-axis");
G2DErr->SetName("G2DErr");

for(size_t ii=0;ii<n_points_red;++ii){
    G2DErr->SetPoint(ii,X[ii],Y[ii],Z[ii]);
    G2DErr->SetPointError(ii,Xerr[ii],Yerr[ii],Zerr[ii]);
}

TCanvas* TECanv = new TCanvas("Canv","Canv",800,600);
TECanv->cd();
TECanv->SetRightMargin(0.15);
G2DErr->Draw("err pcol zcol");
TECanv->SetTheta(90);
TECanv->SetPhi(0);
G2DErr->SetMarkerStyle(8);
Am I doing something wrong? Is there the possibility to get a plot that looks like a “simple” TGraphErrors with only two axis and coloured markers?
YvsX.pdf (21.1 KB)