I am trying to draw a TGraph2D with the “TRI1” drawing option containing data with a z range that is significantly offset from zero.
Here is a slight modification of the SURF1 example given in the TGraph2D class reference:
{
   auto c = new TCanvas("c","Graph2D example",0,0,600,400);
   Double_t x, y, z, P = 6.;
   Int_t np = 200;
   auto dt = new TGraph2D();
   dt->SetTitle("Graph title; X axis title; Y axis title; Z axis title");
   auto r = new TRandom();
   for (Int_t N=0; N<np; N++) {
      x = 2*P*(r->Rndm(N))-P;
      y = 2*P*(r->Rndm(N))-P;
      z = (sin(x)/x)*(sin(y)/y)+0.2 + 10.;
      dt->SetPoint(N,x,y,z);
   }
   gStyle->SetPalette(1);
   // Setting z axis range doesn't work.
   //   dt->Draw("tri1z");
   //   dt->GetZaxis()->SetRangeUser(dt->GetZmin(),
   //      				dt->GetZmax());

   // Setting z axis range works, but colors are not updated.
   auto dth = dt->GetHistogram();
   dth->Draw("tri1z");
   dth->GetZaxis()->SetRangeUser(dt->GetZmin(),
   				 dt->GetZmax());

}
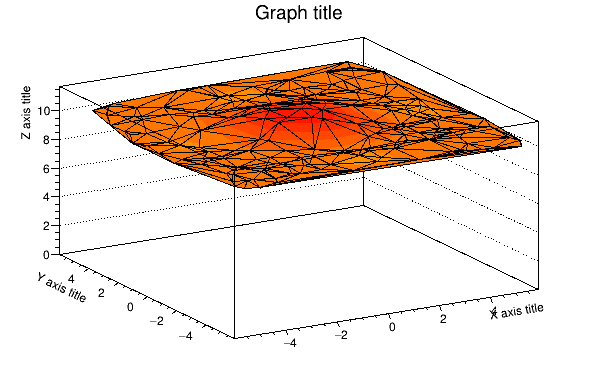
If I draw the TGraph2D with the “tri1z” option, I find that using GetZaxis()->SetRangeUser() to set the z axis range has no effect. The lower limit of the z axis (and the corresponding color map) has a lower limit of 0:
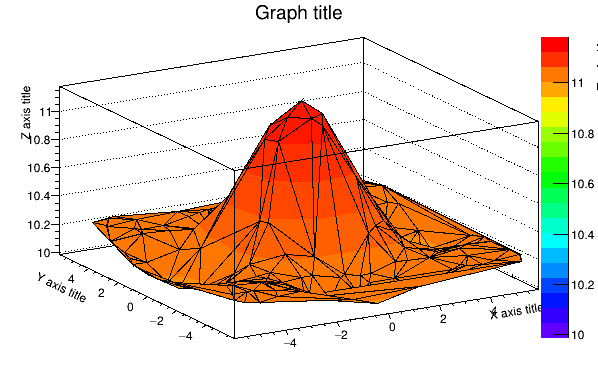
If I use the GetHistogram() method and try drawing the histogram instead, setting the z axis range does work, and the color range bar updates, but the coloring of the surface is not updated accordingly.
ROOT Version: 6.28/04
Platform: linuxx8664gcc
Compiler: c++ (Ubuntu 9.4.0-1ubuntu1~20.04.1) 9.4.0