TGraph2D slow performance

Hi,

I am doing a plotting test with a TGraph2D object used in a standalone application running on a MacBook Air (11-inch, Early 2014) 1.4 GHz Intel Core i5, 8 GB 1600 MHz DDR3, l HD Graphics 5000 1536 MB.
I use ROOT v6.04.08 and Xcode 7.2.

The relevant code is:

void GUI::Plot()
{
watch->Start();

phi_x += PHI;
phi_y += PHI;
if (phi_x > (2*PI - PHI))
{
    phi_x = 0;
}
if (phi_y > (2*PI - PHI))
{
    phi_y = 0;
}

graph->Clear();                                                                                                            

for (i = 0; i < N; i++)
{
    for (j = 0; j < M; j++)
    {
        k = j + i*N;                                                                                                       
        x = i;                                                                                                             
        y = j;                                                                                                            
        z = A*sin(6.28*i/M + phi_x)*cos(6.28*j/N + phi_y);                                                                
        graph->SetPoint(k, x, y, z);                                                                                       
    }
}

printf("Elasped time (computation) [s] = %lf\n", watch->CpuTime());

watch->Start();
graph->Draw("surf1");                                                                                                       
fCanvas->Modified();                                                                                                       
fCanvas->Update();               
                                                                                      
printf("Elasped time (visualization) [s] = %lf\n", watch->CpuTime());

}

The method is invoked by a timer somewhere else defined in my code.
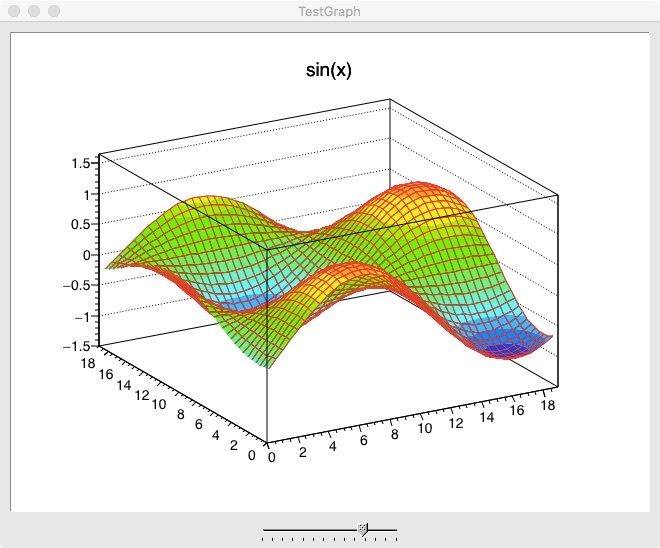
This code is supposed to generate an animated moving sheet with sinusoidal bumps propagating on it.
The calculation of the data points (M x N = 20 x 20 = 400) is made on the fly (not recalculated) on purpose in order to have a benchmark of the computational capabilities.

As expected, the time required for the computation, printed by a stopwatch, is basically zero.
But the time required for the visualisation varies around 150ms for each render.
The timer set to trigger the plotting method as been set to 100ms, so the plot comes always late. Originally, I thought it was possible to get plots every 20ms (so that I could think of making a fluid animation) but this has been impossible to achieve.

I can understand the plotting requires some time in order to be generated, but what I cannot understand is why, at the same time, in case I spin my plot by dragging the graph with the cursor in order to change the viewpoint this movement occurs very rapidly. I can, for instance, spin my plot in crazy fast way and have it rendered in different new viewpoints basically immediately but still each frame is generated very slowly.
The latter observation make me thinking I am doing something wrong while generating such plot.

What am i doing wrong and why is my plot so slow?

P.S. please find a screenshot of my animated plot attached to this post.


Best regards,

Erik

The triangulation code has been change in 6.06 and gives a huge improvement in performances.

As far as I understand from your answer the triangulation algorithm takes time while, once having produced the OpenGL code as an intermediate output from the triangulation, the rendering itself might (and should) be fast because it is performed by the GPU. Because of this, the (supposed little) time taken by the rendering itself could be easily covered by the (supposed big) one taken from the triangulation. Is that correct?

I downloaded root 6.06.00 and things now are better: the same code render a frame in 40…50 ms, instead of 150ms. Still not great, but definitely better!
But there is one other thing: the first time a use the mouse cursor to change the plot viewpoint makes all the subsequent plots being rendered about twice slower (80…100 ms). Once this happens, the only way to have the rendering fast again is to quit the application and relaunch it, without moving the point of view of the plot of course. This slower response after the first modification of the viewpoint was also present with root 06.04.08, but was less pronounced compared to the already slow plot performance for that version.

Do you have an idea of why this is happening?

Thanks,

Erik

If you draw the triangles from the a TGraph2d the delaunay triangulation algorithm is invoked. That’s not a triangulation in the OpenGL sense .

we will need a running example to understand that.

Please, find an Xcode example (source code only) attached to this post:
I could not attach the complete Xcode project because it is too big for the post (4.8Mb). Is there any way to post such a zip file?
The dictionary, once created with:
rootcling -f GUI_Dict.cpp -c GUI.hpp LinkDef.hpp
should be placed in /DerivedData/TestGraph/Build/Products/Debug.
If you try running that example you will see the execution time printed to the stdout.
It is clearly evident that as soon as the view point of the graph is changed for the first time the plot itself gets much slower, not the computation of its data points.

Maybe another cause of the slow performance is the following plotting code I use:
(in GUI.cpp)

//fCanvas->SetEditable(kTRUE);
graph->Draw(“surf1”);
fCanvas->Modified();
fCanvas->Update();
//fCanvas->SetEditable(kFALSE);

?

If I uncomment both “fCanvas->SetEditable” statements then, of course, I loose the possibility of controlling the point of view of the graph but it never gets slow.

Best regards,

Erik
Archive.zip (7.23 KB)

I guess you can put it on dropbox or equivalent. But can you not just provide a small macro reproducing the behaviour ? we do not need you full program.

I can, but is the performance of the interpreted macro going to be the same of that one of the compiled code?

Erik

Yes, we can compile it using Aclic

Please find attached to this post the macro file.

When you run it watch the stdout: it prints both the “computation” time and the “visualisation” time.
On my mac the computation time, which here corresponds to the time necessary to generate the data plot, is always basically zero. But the visualisation time varies according to what previously described: after changing the point of view for the first time, the plot update gets about twice slower.
Graph.c (16.5 KB)

I get:

root [0] .L Graph.c++
Info in <TMacOSXSystem::ACLiC>: creating shared library /Users/couet/Downloads/./Graph_c.so
In file included from input_line_12:9:
/Users/couet/Downloads/./Graph.c:5:10: fatal error: 'LinkDef.hpp' file not found
#include "LinkDef.hpp"
         ^
Error in <ACLiC>: Dictionary generation failed!

Oops, please find the missing file attached to this post!
Anyway, could you try just executing the Graph.c macro within root (.x Graph.c), after commenting or deleting the "#include “LinkDef.hpp” line in it?

This should be enough to see the code running and have it manifesting the described behaviour.
LinkDef.hpp (355 Bytes)

Thanks,

Not I can run it.

What should I get ? do ?

what I have now is:

root
   ---------------------------------------------------------------
  | Welcome to ROOT 6.07/03                   http://root.cern.ch |
  |                                  (c) 1995-2014, The ROOT Team |
  | Built for macosx64                                            |
  | From heads/master@v6-07-02-41-g37014e2, Jan 06 2016, 17:13:11 |
  | Try '.help', '.demo', '.license', '.credits', '.quit'/'.q'    |
   ---------------------------------------------------------------

root [0] .L Graph.c++
Info in <TMacOSXSystem::ACLiC>: creating shared library /Users/couet/Downloads/./Graph_c.so
In file included from /Users/couet/Downloads/Graph_c_ACLiC_dict.cxx:41:
/Users/couet/Downloads/./Graph.c:156:19: warning: comparison of integers of different signs: 'int' and 'const unsigned int' [-Wsign-compare]
    for (i = 0; i < N; i++)
                ~ ^ ~
/Users/couet/Downloads/./Graph.c:158:23: warning: comparison of integers of different signs: 'int' and 'const unsigned int' [-Wsign-compare]
        for (j = 0; j < M; j++)
                    ~ ^ ~
2 warnings generated.
root [1] 

what is the next step ?

Could you try running it as a macro (not compiling) by doing:
.x Graph.c

at the root’s prompt, instead of:

.L Graph.c++

?

You should get something like this:
Eriks-MacBook-Air:~ Erik$ cd Desktop/
Eriks-MacBook-Air:Desktop Erik$ root

| Welcome to ROOT 6.06/00 root.cern.ch |
| © 1995-2014, The ROOT Team |
| Built for macosx64 |
| From tag v6-06-00, 9 December 2015 |

Try ‘.help’, ‘.demo’, ‘.license’, ‘.credits’, ‘.quit’/’.q’

root [0] .x Graph.c
(int) 0
root [1] Elapsed time (computation) [s] = 0.000000
Elasped time (visualization) [s] = 0.120000
Elapsed time (computation) [s] = 0.000000
Elasped time (visualization) [s] = 0.050000
Elapsed time (computation) [s] = 0.000000
Elasped time (visualization) [s] = 0.050000
Elapsed time (computation) [s] = 0.000000
Elasped time (visualization) [s] = 0.060000
Elapsed time (computation) [s] = 0.000000
Elasped time (visualization) [s] = 0.050000
Elapsed time (computation) [s] = 0.000000
Elasped time (visualization) [s] = 0.050000
Elapsed time (computation) [s] = 0.000000
Elasped time (visualization) [s] = 0.050000
Elapsed time (computation) [s] = 0.000000
Elasped time (visualization) [s] = 0.050000
Elapsed time (computation) [s] = 0.000000
Elasped time (visualization) [s] = 0.060000
Elapsed time (computation) [s] = 0.000000
Elasped time (visualization) [s] = 0.050000

plus a window where you can see a 3D plot with a sinusoidal sheet.

When you rotate the view of that plot for the first time you should read the following change in the timing at the stdout:
Elapsed time (computation) [s] = 0.000000
Elasped time (visualization) [s] = 0.090000
Elapsed time (computation) [s] = 0.010000
Elasped time (visualization) [s] = 0.090000
Elapsed time (computation) [s] = 0.000000
Elasped time (visualization) [s] = 0.080000
Elapsed time (computation) [s] = 0.000000
Elasped time (visualization) [s] = 0.090000
Elapsed time (computation) [s] = 0.000000
Elasped time (visualization) [s] = 0.090000
Elapsed time (computation) [s] = 0.000000
Elasped time (visualization) [s] = 0.090000
Elapsed time (computation) [s] = 0.000000
Elasped time (visualization) [s] = 0.090000
Elapsed time (computation) [s] = 0.000000
Elasped time (visualization) [s] = 0.090000

As you see, after changing the point of view for the first time the “visualisation time” gets bigger.

Yes I see that now … no idea why it does that.

It is even more surprising to me the further slow performance it gets in case you try increasing the size of the grid of point on which the software computes the sinusoid, which means setting these lines of the code:
const unsigned int N = 20; // Number of x-points in the graph [#].
const unsigned int M = 20; // Number of y-points in the graph [#].

to something like: N = 200 and M = 200.

This makes the plotting time becoming very slow, but still it looks like the rendering is very fast: if you try spinning the plot with the mouse is super fast!
This lead me to think the plotting code really does go to to the GPU shaders (otherwise I guess it should be impossible to have it displaying so fast graphic variations). However, notice that when you spin the plot with the mouse, the execution of the code is stopped (no printf on the stdout).
For this I think the problem might be something connected to the management of the plotting thread and the working thread (which I do not control directly in this code, ROOT takes care about it).

Do you have any idea about this, or any suggestion on how to proceed with this investigation?
On the other hand, should I consider this problem not solved and close this topic?

Thanks

Erik

When you increase the number of points the Delaunay triangulation takes more time.
But the drawing should not … you do graph->Draw(“surf1”);
which draws the resulting histogram filled using the triangulation … the algorithm to draw
it is build-in in ROOT … not GPU behind… but it is fast … and drawing a 20x20 histogram is as fast as a 200x200 histogram

I see your point.
Is there any other way available in ROOT in order to get such kind of plots I am doing in this example without having to pass through the Delaunay histogram triangulation? Maybe something more low-level?

If your data are on a regular grid use a TF2 or a TH2 (F or D) .

I have tried using TH2F, as you suggested. Now it’s about twice faster but still the behaviour remains the same: as soon as I change the point of view for the first time, then the visualisation gets again about twice slower.

Any idea about that? I believe the underlying issue is the same.

Please, find the code attached to this post (run it inside a ROOT shell session with “.x Histogram.c”).

Thanks

Erik
Histogram.c (16.4 KB)

I see the effect you describe with your macro. I have no idea right now from where it could comes from.