TGraph2D set axis title

Hi everybody,
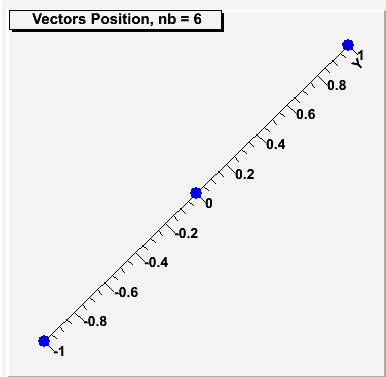
I have I problem when I try to set axis title on my TGraph2D (I’m under windows). I tried the code below but it gives me a strange image (see the picture):

[code]TGraph2D *g1 = new TGraph2D(6);
g1->SetPoint(0,1,0,0);
g1->SetPoint(1,0,1,0);
g1->SetPoint(2,0,0,1);
g1->SetPoint(3,-1,0,0);
g1->SetPoint(4,0,-1,0);
g1->SetPoint(5,0,0,-1);

g1->SetMarkerStyle(20);
g1->SetMarkerColor(kBlue);
g1->SetMarkerSize(1.5);
g1->GetXaxis()->SetTitle(“X”);
g1->GetYaxis()->SetTitle(“Y”);
g1->GetZaxis()->SetTitle(“Z”);
g1->Draw(“P”);[/code]

Hi,

try with (slightly) more reasonable data, e.g.

TGraph2D *g1 = new TGraph2D(6);
g1->SetPoint(0,1,0,0);
g1->SetPoint(1,0,1,1);
g1->SetPoint(2,0,0,2);
g1->SetPoint(3,-1,0,3);
g1->SetPoint(4,0,-1,4);
g1->SetPoint(5,1,1,5);
   
g1->SetMarkerStyle(20);
g1->SetMarkerColor(kBlue);
g1->SetMarkerSize(1.5);
g1->GetXaxis()->SetTitle("X");
g1->GetYaxis()->SetTitle("Y");
g1->GetZaxis()->SetTitle("Z");
g1->Draw("P");

and your code should work…

Thomas


Hi schieti,

Thanks for your great help! I tried with many points and it works eccept with theses “non reasonables data”. But the problem is that the data that I will use will be “non reasonable”. (It’s a part of my application, it will show molecules in the space). So I would like to know if exists a way to correct it?
Another time thank you very much.

Ah, sorry, I misunderstood. Still, setting the same point (0,0) to two different values does seem very unreasonable to me, at least for a TGraph2D, molecule or not. It somehow defeats the purpose of a TGraph2D (as an interpolated surface defined by unevenly spaced points).

I would look for a class that is better suited for your molecules…

Thomas

g1->SetPoint(2,0,0,1);
g1->SetPoint(5,0,0,-1);  // define value of (0,0) again!!

Hi Thomas,
Thank you for your explanation and interest, you are right TGraph2D is not the best thing to molecules’s position in the space (I forget this particular, TGraph is for surfaces :slight_smile:, sorry).
So I would thank you very much if you find somenthing better than TGraph2D.
Cheers,
Louis

Again I think you should use TPolyMarker3D instead of TGraph2D. You are not using any of the features TGraph2D provides. All you do is 3D markers.

Hi,

I found this thread because I had the same issue - I guess I am also using the wrong class, I get lots of warnings that look like this:

Warning in TGraphDelaunay::Interpolate: Two of these three points are coincident 48 94 81

However, if I use TPolyMarker3D , I get the set of points but with no axis!

So - what is the way to create a plot of markers in 3 dimensions with valid axes?

thanks!
Peter

Can you provide a small example showing what you get ?

Hi,

I’ve attached two files - the first is a small TFile containing a TTree with some data. The second is a short script which just plots three of the parameters against each other and then adds titles to the axes.

When I run it I get multiple errors (e.g.)

Warning in TGraphDelaunay::Interpolate: Two of these three points are coincident 113 135 105

But the plot is still created - and looks as I expect - except that the axis titles are absent.

thanks
Peter
testGraph2D.C (1.52 KB)
data.root (15.2 KB)

Sorry I forgot to add that I am running root 5.30/02 on OS X 10.7.2 with gcc 4.2.1

thanks
Peter

When I run it I get multiple errors (e.g.)

Warning in <TGraphDelaunay::Interpolate>: Two of these three points are coincident 113 135 105

I see the same. And it means what the message says: you have many similar points. That’s it …

Hi,

yes I am ok with that - but does it explain why the axis titles do not appear? Do they appear for you?

thanks for the help
Peter

No they don’t … actually the axis do not appear at all.

Oh … yes … I see… drop option A
A means “No axis” (see doc)

great thanks!