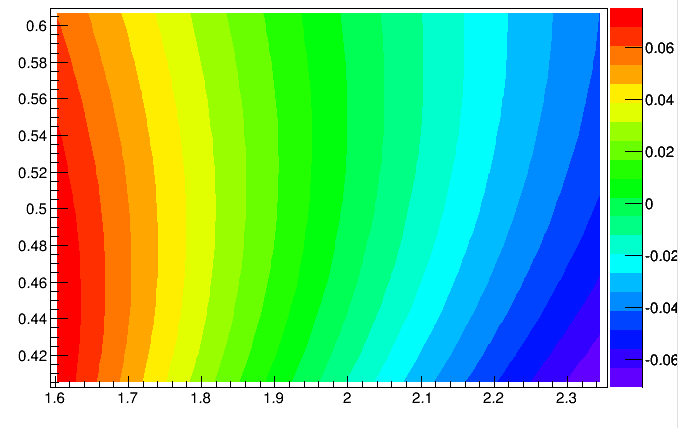
I have a 2D TGraph, with a colour column next to it (see below).
I want to manually choose where to label the ticks, and ideally not with numbers but with letters (s_1, s_2 etc.). The same for the colour chart on the left.
Like in Matlab basically, where I can define the set of tick labels.
Any ideas on how to do this?