I am doing some testing with TGraph2D objects and have run into some issues. The first issue appears after drawing the TGraph2D with the LINE option, when one tries to rotate the figure using the mouse on the canvas a segmentation fault is thrown. This occurred originally in the following python script, but I found it also happens in a C++ script as well. This bug appears in the latest 6.11.02 release.
The error message:
$ root TGraph2D.C
root [0]
Processing TGraph2D.C...
Info in <TCanvas::MakeDefCanvas>:  created default TCanvas with name c1
root [1] root.exe(40685,0x7fff9e670340) malloc: *** error for object 0xbfa66083c0c91240: pointer being freed was not allocated
*** set a breakpoint in malloc_error_break to debug
The python script:
import numpy as np
import ROOT

num_pnts = 20

radius = 10E3
phi = np.radians(90)
theta = np.radians(np.array(range(num_pnts), dtype=np.float64) / num_pnts * 360.)

x = radius * np.sin(theta) * np.cos(phi)
y = radius * np.sin(theta) * np.sin(phi)
z = radius * np.cos(theta)

g = ROOT.TGraph2D(num_pnts, x, y, z)
g.Draw("LINE")
ROOT.gPad.Update()
raw_input("WAIT")
In addition, When trying to plot the TGraph2D n a juypter notebook I am greeted with the following message:
Warning in <TROOT::Append>: Replacing existing TGraph2D: Graph2D (Potential memory leak).
The canvas contains an object of a type jsROOT cannot currently handle (TGraph2D). Falling back to a static png.
Is there a timeline on when this functionality may be incorporated? I assume it is similar to that of plotting TH2 objects with options like SURF.
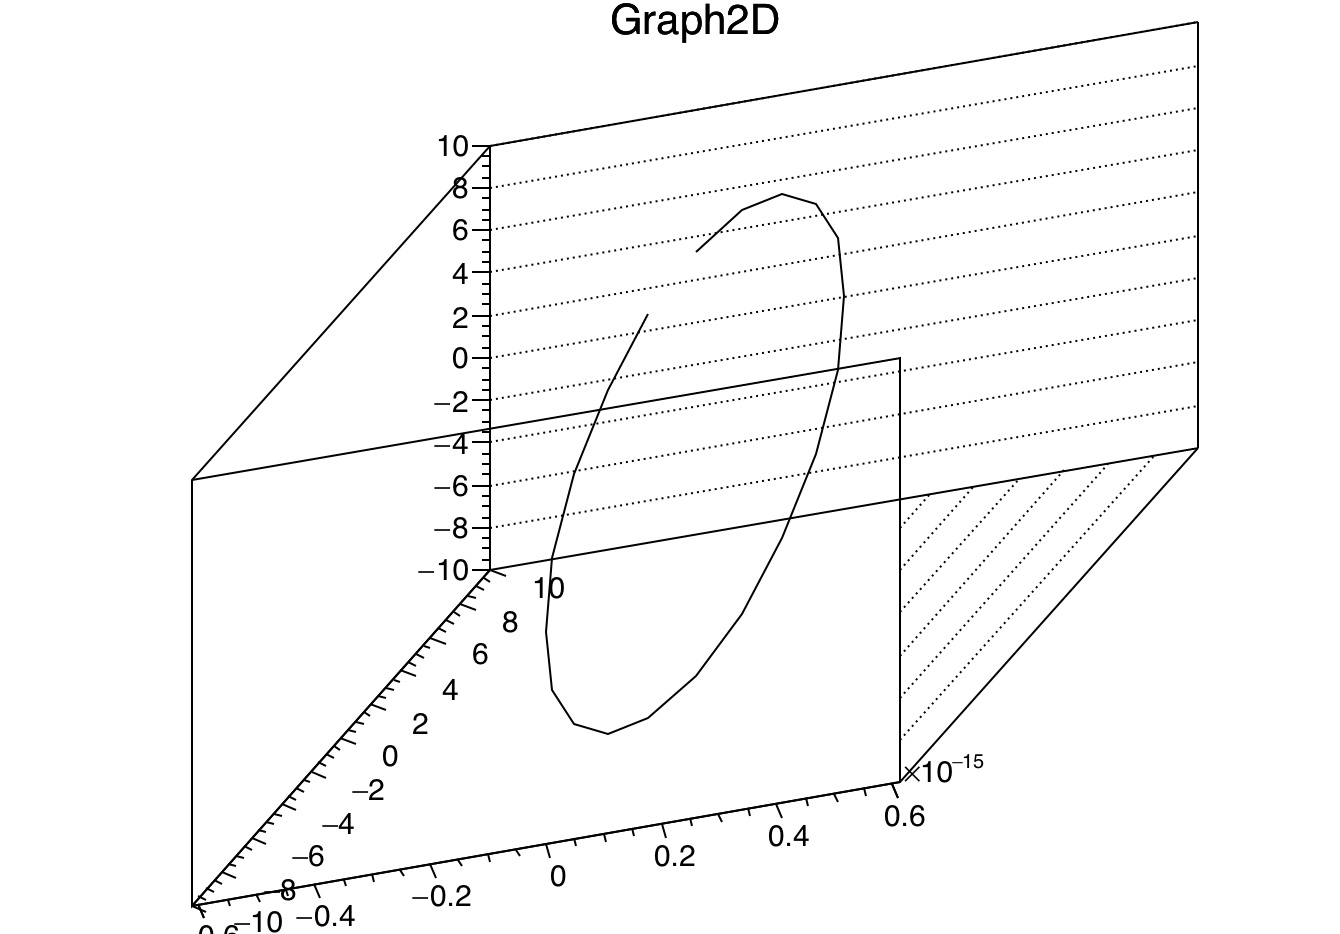
I verified that it does not crash with 6.10. But anyway the picture I get is the same and is a bit weird… (to say the less…) I think it comes for the fact all the points are in the same plane. I am investigating.
From what version is TGraph2D supported in JSROOT? It is easy to make it available for Jupyter (and SWAN) if it’s not already, just a matter of making a link point to it.
Yes, LINE was not supported.
I recognize this one I saw your message.
It is supported now in dev version, will be available for Jupyter in next few weeks: