Hello,
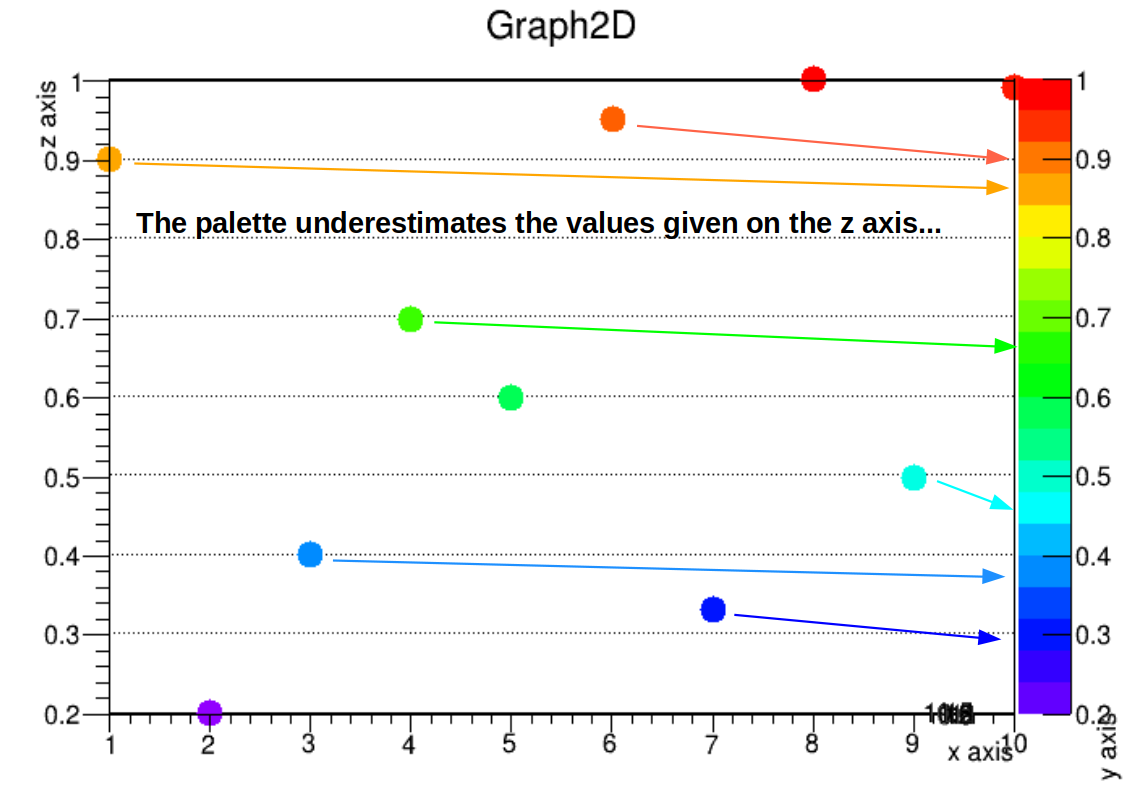
The palette displays a shifted scale on the values on the z axis on a TGraph2D. It shows as if the ploted values were smaller than what I entered. I tried using a TH2 object, and the values are matching the palette scale, but using a TGraph2D is more appropriate for my work. I did tests on a simplified code. I show below the output that I rotated to display the z-axis in parallel with the palette scale.
I also tried to increase the default “NunberContours” – same issue.
I would be grateful if someone can tell me how to correct this shift in the palette scale.
Cheers,
Richard.
_ROOT Version: 6.24/06
_Platform: Ubuntu 20.04.4 LTS
Compiler: gcc version 9.4.0 (Ubuntu 9.4.0-1ubuntu1~20.04.1)
{
   const Int_t N = 10;

   Float_t x[N]= {1. ,  2. ,  3. , 4. ,  5. ,  6.  , 7.   ,  8.,  9. , 10.  };
   Float_t y[N]= {10., 12. , 11. , 8. , 10. , 10.  , 12.  , 11.,  8. , 10.  };
   Float_t z[N]= {0.9,  0.2,  0.4, 0.7,  0.6,  0.95,  0.33,  1.0, 0.5,  0.99};

   gStyle->SetPalette(1);

   TGraph2D *g=new TGraph2D(N,x,y,z);
   g->SetMarkerStyle(kFullCircle);
   g->SetMarkerSize(2);
   g->Draw("PCOLZ");
   gPad->SetGridx(); // not working
   gPad->SetGridy(); // not working
   //g->SetMinimum(0.2);
   //g->SetMaximum(1.0);
   gPad->SetTheta(90.); gPad->SetPhi(0.001);
   g->GetXaxis()->SetTitle("x axis");
   g->GetYaxis()->SetTitle("y axis");
   g->GetZaxis()->SetTitle("z axis");

   c1->Print("Test_Graph_2D.png");
 }