ROOT Version: Latest as of 23.02.21 Platform: Ubuntu Compiler: Not Provided
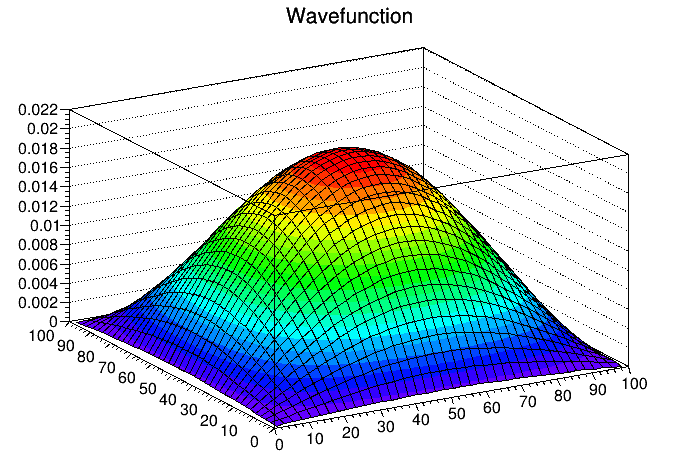
I’m having an error with TGraph2D, where I am getting values of zero at x = 0 and y = 0 when I cout them, but they are higher than zero on the TGraph2D. What is the problem here?![
Yes, the value at [0,0] is also graphically 0, but the edges are curved in the positive direction. According to the formula I am plotting, the edges should also be 0.
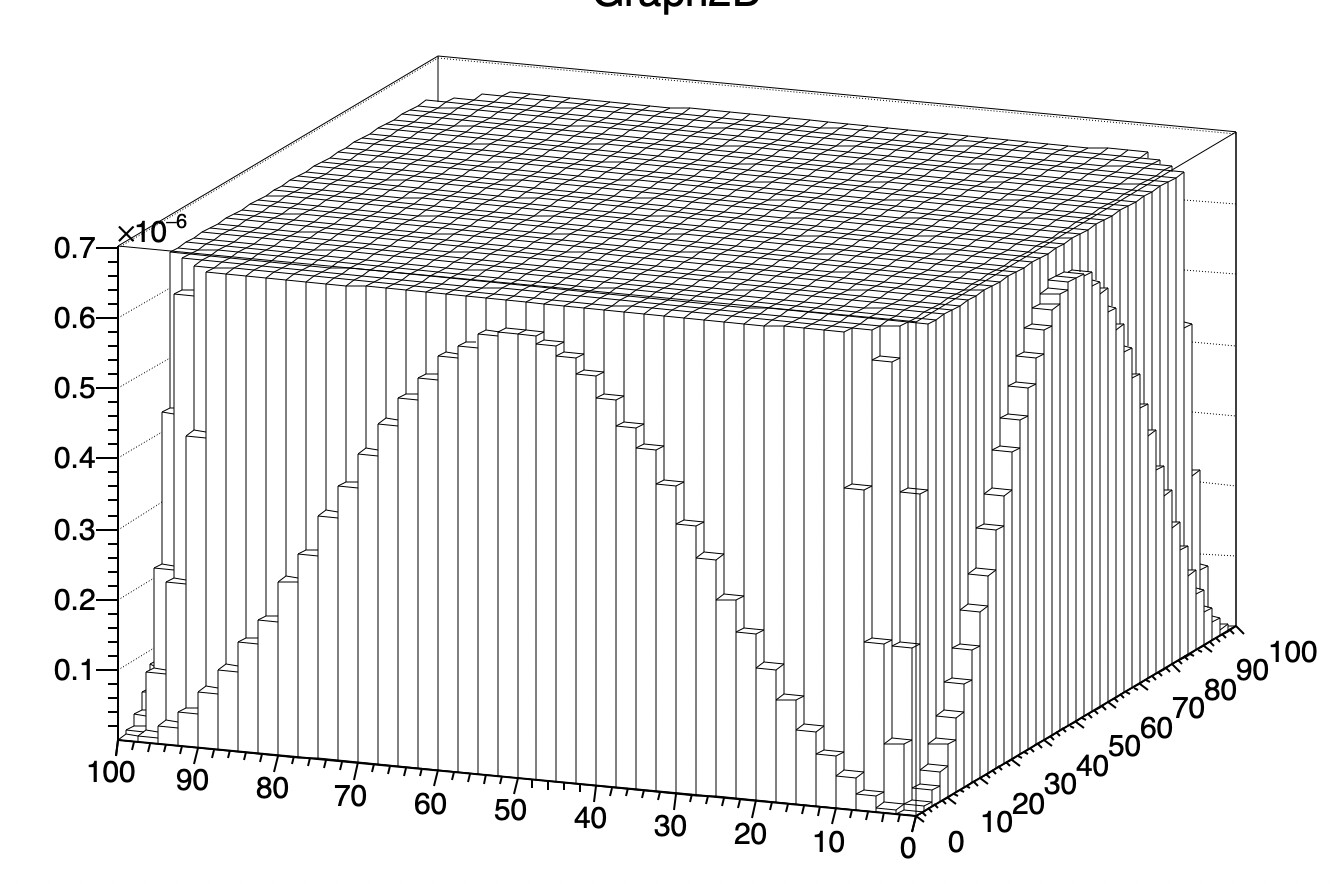
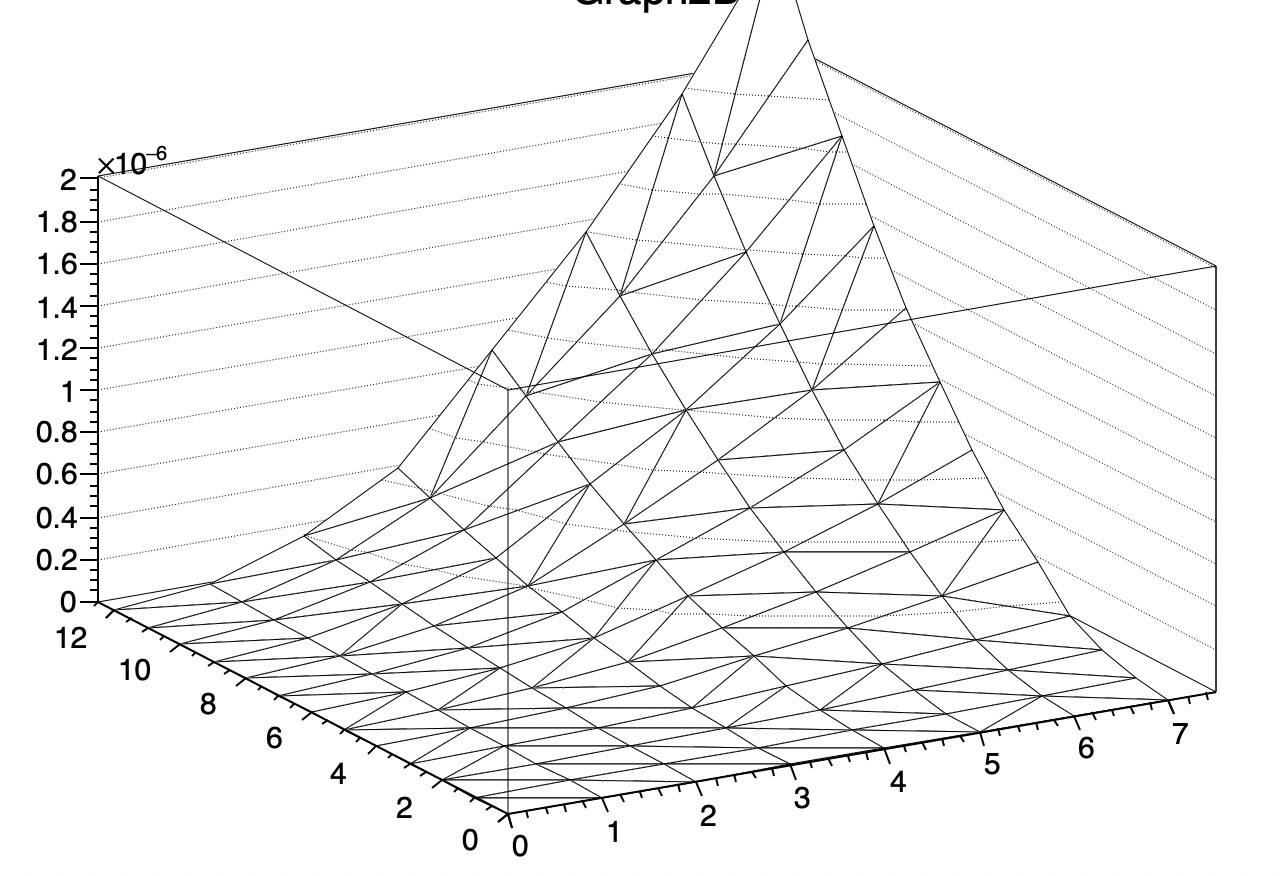
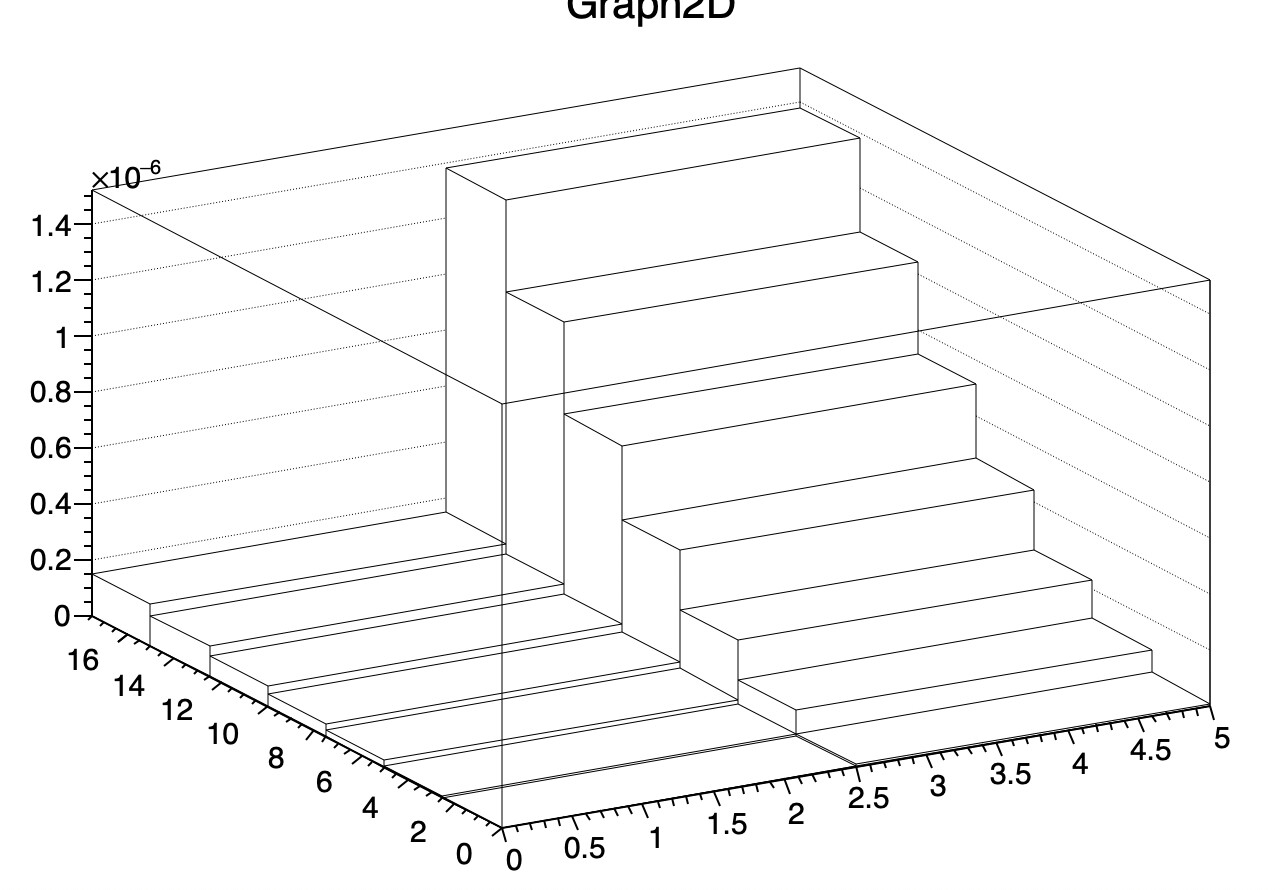
ROOT does not draw “external edges” in this case. The first drawn lines correspond to some “bin centers” (a 2D graph is drawn with help of an automatically created histogram). So, even if the values on “external edges” are exactly 0, the values at the “bin centers” of the most “external bins” are not.
//
// Created by AdvaitD on 22/02/2021.
// Display the wavefunction and amplitude of an electron in a box
//

#include <TMath.h>
#include <math.h>


float pi = TMath::Pi();

float L = 100; // m

int nx, ny, n;

float roundval(float var)
{
    float value = (int)(var*100+.5);
    return (float)value/100;
}
float waveFunction2D(float energyLevelx, float energyLevely, float lengthx, float lengthy)
{

    	float wave = (2/L) * ( roundval(sin(energyLevelx * (lengthx/L) *pi)) )*( roundval(sin(energyLevely * (lengthy/L) *pi)));
    	return wave;

}
float Amplitude2D(float wave)
{
    float amp =  wave * wave;

    return amp;

}
void electrons()
{
    cout << "Enter a value for n in x direction:" << endl;
    cin >> nx;
    cout << " Enter a value for n in y direction:" << endl;
    cin >> ny;

    TGraph2D *WaveFunctionTwo = new TGraph2D();
    TGraph2D *AmpTwo = new TGraph2D();

    int count = 0;
    for (int j = 0; j <= L; j++ )
    {
        for (int k = 0; k <= L; k++)
        {
            WaveFunctionTwo->SetPoint(count, j, k, waveFunction2D(nx, ny, j, k));
            AmpTwo->SetPoint(count, j, k, Amplitude2D(waveFunction2D(nx, ny, j, k)));
            count++;


        }
    }
    TCanvas *c1 = new TCanvas();
    gStyle->SetPalette(1);
    WaveFunctionTwo->SetTitle("Wavefunction");
    WaveFunctionTwo->Draw("surf1");
    TCanvas *c2 = new TCanvas();
    gStyle->SetPalette(1);
    AmpTwo->SetTitle("Amplitude");
    AmpTwo->GetXaxis()->SetTitle("x");
    AmpTwo->GetYaxis()->SetTitle("y");
    AmpTwo->Draw("surf1");
    c1->Print("wavefunction.png");
    c2->Print("amplitude.png");
}
Now, the value that the function waveFunction2D() returns is 0 when lengthx == 0, lengthx == L, lengthy == 0 and lengthy == L. These are the edges. When I cout this in the function itself, I get a bunch of zeros. But when I plot them on the TGraph2D, they seem to be above zero in a curve.
The lego and surface are obtained by filling an underlying histogram. As you can see the bin on the edge are not really 0. Only the conners are. It might be that the bins are to large and that one bin has several triangle above. You can try to increase the number of bins of the underlying histogram (SetNpx SetNpy see doc)