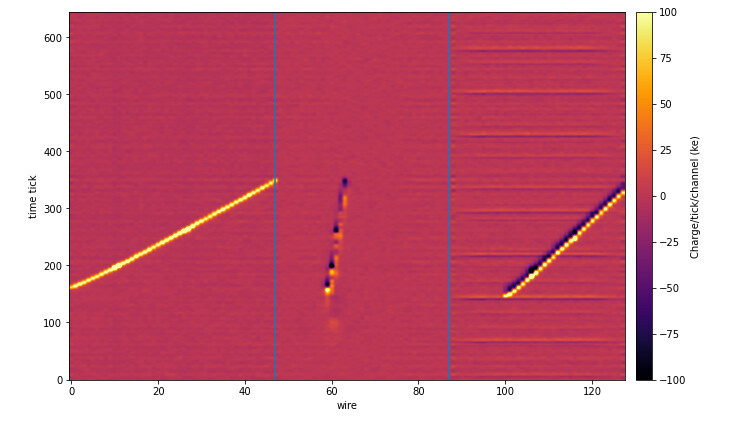
I am trying to create 2D graph as shown below.
My code:
n = 82560
g = ROOT.TGraph2D()
for x in range(128):
for y in range(645):
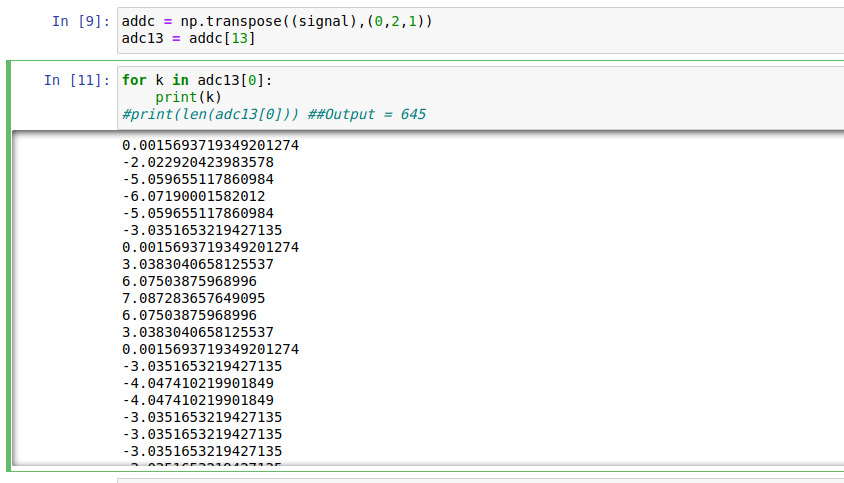
for z in adc13[x]:
g.SetPoint(n,x,y,z)
c1 = ROOT.TCanvas("c1")
g.Draw("TRI2 Z")
ROOT.gPad.Update()
g.GetXaxis().SetTitle("X-axis")
g.GetYaxis().SetTitle("Y-axis")
g.GetZaxis().SetTitle("Z-axis")
c1.SetTheta(0.0-0.001)
c1.SetPhi(0.0+0.001)
ROOT.gStyle.SetHistTopMargin(0)
c1.Print("TGraph2D_example1.png")
This code does not give me any output.
To be more precise.
X = [0,1,2, …, 127] (128 elements)
Y = [0,1,2,…, 644] (645 elements)
Z = [ different values] (128 x 645) = 82560 elements.
I am trying to plot like these:
(x,y,z)
(0,0,Z[0])
(0,1,Z[1])
(0,2,Z[2])
…
…
(0,644,Z[127])
(1,0, Z[128])
(1,1,Z[129])
…
…
Last two
(127, 643, Z[82449])
(127, 644, Z[82450])
I could not figure out what’s wrong in my code. It is not producing any plots. Thank you.