If I directly set the points or read a file I saw some zeros that are not in the data.
After investigation, I realized that if I am using a data set smaller (fNpoints <= 483) than the real one (several hundreds) the result is the one expected (with the limited number of points of course).
My question is: is there any limitation on the number of points and if yes how can I extend it ?
I am using ROOT 5.34/18
Thank you for your quick reply but speed is not exactly the problem.
Furthermore, it does not depend on the type of draw option I am using (even w/ “TEXT” I can see the zeros)
However the post you pointed me at does indirectly suggest that there is a internal limitation, since my colleague is using there thousands of points.
Regards
Julien
Ps: I saw later your edit and the 2nd post your suggested. SetMaxIter() does not seem to change things, which is logical since my problem does not seem to depend the draw method…
Where your picture (“c1.png”) shows " 0 ", I simply see a “white space” (I tried it with ROOT v5-34-22 and v6-02-01) but the rest of the picture looks the same, except that the title of your canvas looks different from mine and I have no “date” in the bottom-right.
Well, I think you must have something in your “~/.rootrc” and/or “./.rootrc” and/or “./rootlogon.C” files that changes the default behavior.
Well, I think I have found a potential cause … see if you use anywhere:
gStyle->SetHistMinimumZero(kTRUE);
and if yes, just before drawing the graph, change it into:
gStyle->SetHistMinimumZero(kFALSE);
no it does not solve the problem (now I have white space like you do but there must be something there > 0 !)
I guess “TEXT” also do some interpolation (that fails here ?).
I look at the TGraph2D documentation and did not found a way to obtained the values (like a GetPoint() method).
This could be a solution to decide if the problems comes from the interpolation (as the posts you point me
at suggest) or from a bad “reading” of the points (from the file)
Add two new “artificial” points to your “tmp.dat” file:
-0.1 -0.1 1.0
0.7 0.4 13.0
then try:
TGraph2D *g = new TGraph2D(“tmp.dat”)
g->Draw(“P0”)
or try:
TTree *t = new TTree(“t”, “t”)
t->ReadFile(“tmp.dat”, “x/D:y:z”)
t->Draw(“z:y:x”)
t->Scan()
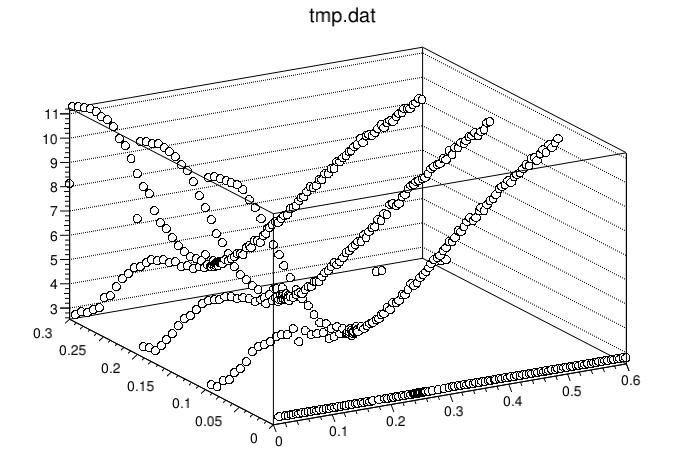
There’s some kind of a bug in the g->Draw(“P0”) graphics output -> an additional circle is drawn right in the middle of the canvas at around “0.3 0.15 7.0” (this additional circle stays in the middle when one rotates the picture using the mouse).
I think this bug is related to the fact that one point is NOT drawn at all -> “0.7 0.4 13.0” is missing.
I can reproduce this bug using a modified “tmp.dat” file (attached). Note that in this case a whole bunch of points are missing (all points with y = 0.3) and this additional circle right in the middle is present at around “0.3 0.2 6.9”.
This bug exists in ROOT v5-34-22 and v6-02-01. tmp.dat (8.37 KB)
Yes. This is exactly why I started looking at this problem.
Note that I tried to read the Graph values (to test if the problem come from the display or the data “storage” in TGraph2D) but the Print() method as implemented in TGraph (1D) is not present in TGraph2D. And no GetPoint() method as well.
TGraph2D *g = new TGraph2D("tmp.dat");
g->Draw("p0");
Then I saved the canvas in a c1.C file… with some editing I made a c1.dat file to ease the comparison with tmp.dat. Both data set are the same. I noticed that straight line you have at Y=0 …
it is indeed in your data set you have several point like xxx 0 2.7807 … they draw this line…
I could not identify any wrong plot in the plots I get (see the attached plot).
Your “small data set” shows one problem only -> some points are not drawn in the canvas.
With my data set you should also see another bug -> an additional artificial circle in the middle of the canvas (a “false” additional data point).