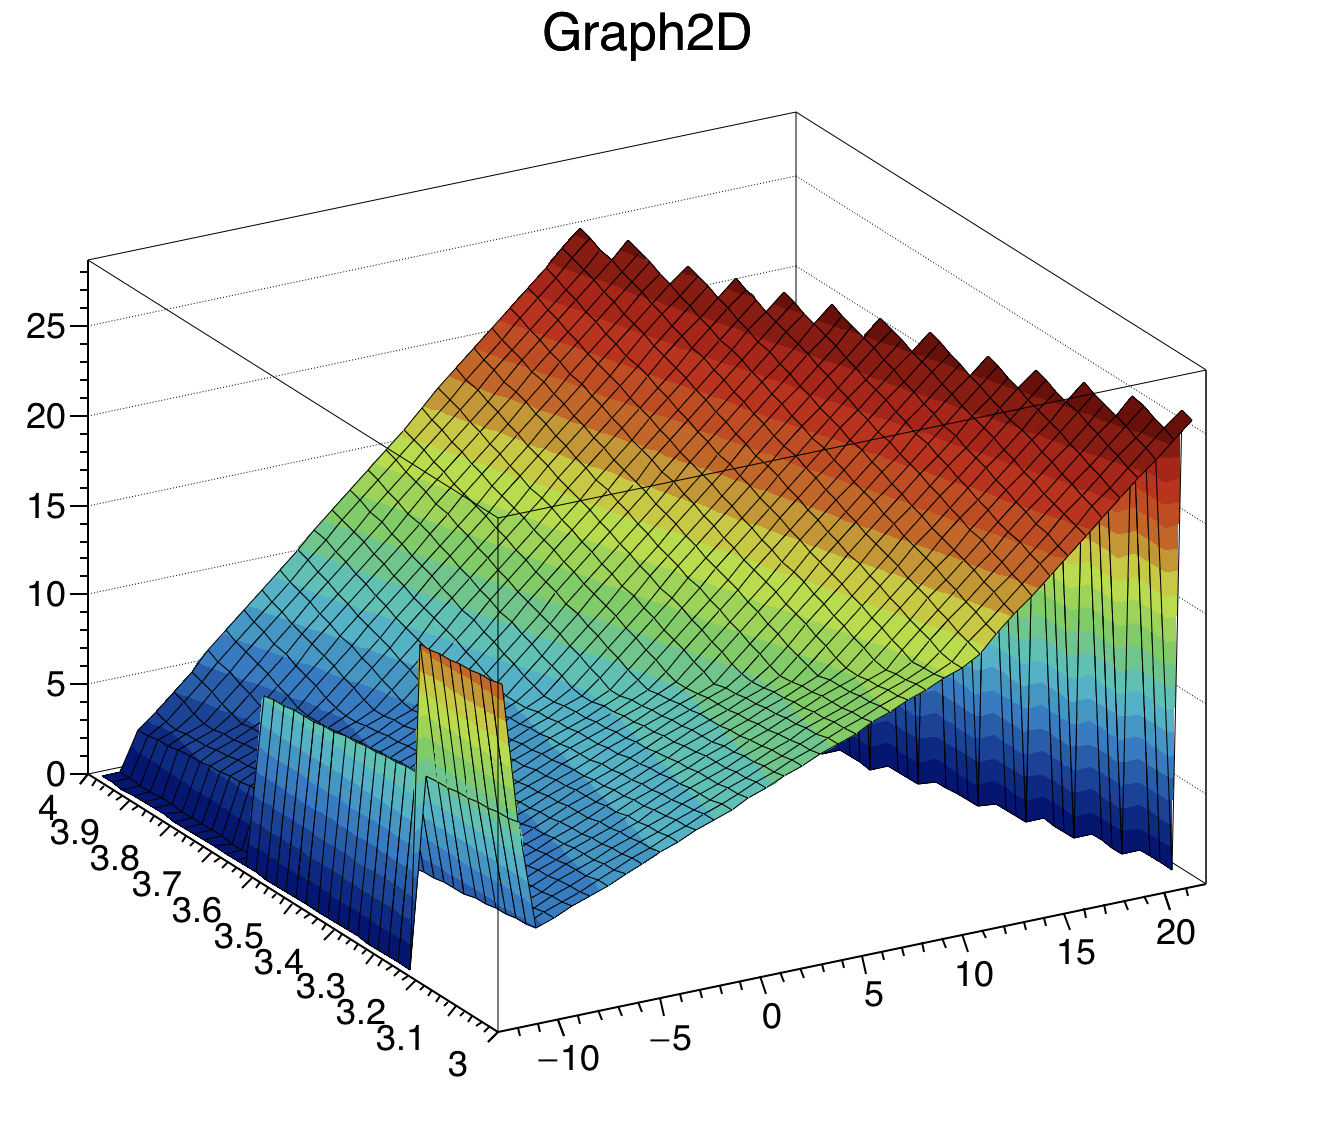
I am an undergarduate researcher new to ROOT. I am trying to use a TGraph2D to help plot some hit data. I would like for my x axis to be the Monte Carlo particle identifier, my y axis to me a number ( 1 to 4) that reflects the level that particle hit, and the z axis to be the number quantity of events that share the same x,y ordered pair. I am at a loss. this is all I have. thank you for your time.
   Canvas *c = new TCanvas("c"0,0,700,600);
   Double_t x = {-11,-11,11,11,-11,-11,22,11,11,11,11,-11,11,11,11,11,22,22,22,22,11,11,-13,11,11,22,22,11,11,-11,22,22,-11,22,22,11,11,11,11,11,11,-11,11,11,22,-11,-11,11,11,13};
Double_t y = {3,4,3,4,3,3,3,3,4,3,4,3,3,4,3,4,3,3,3,3,3,4,3,3,4,3,3,3,4,3,3,3,3,3,2,3,4,3,4,3,4,3,3,4,3,3,3,3,4,3};
Double_t z = {1,2,3,4,5,6,7,8,9,10,11,12,13,14,15,16,17,18,19,20,21,22,23,24,25,26,27,28,29,30};
Int_t np = 200;
   TGraph2D *dt = new TGraph2D();
for (Int_t N=0; N<np; N++)
{
dt->SetPoint(N, x[N], y[N], z[N]);
}

   gStyle->SetPalette(55);
   dt->Draw("surf1");   ```