I am trying to import data from a file where the information is stored in a grid, not in X/Y/Z format. The reason I would like to get this format is that I have 16000 columns and hundreds of rows. So storing the X/Y values every time seems a waste.
In my case, only the Z value would be presented and the corresponding X and Y would the column- and row-indices:
root [51] TGraph2D *g = new TGraph2D("test.res")
root [52] g->Draw("surf2")
At the moment this code only reads the first 3 columns of my file and interpret them a X/Y/Z. In my case I would like to use something like this:
root [51] TGraph2D *g = new TGraph2D("test.res",format="grid")
root [52] g->Draw("surf2")
Eventually, the real X and Y values could be given separately in 2 other vectors, otherwise the index is just fine.
As my knowledge of ROOT is quite limited, I was wondering whether there were already a method implemented to do such a plot ?
If not, could you please advise me for the easiest way to implement this ?
If your X,Y value are on a regular grid, why don’t you use a 2D histogram ? TGraph2D is meant to be use when your data are (x,y,z) values not necessarily distributed on a regular grid.
I do indeed have a regular grid. I decided not to chose Histograms because my peaks are obtained with very few loci (values of X/Y). So I was concerned that using an histogram would average them over a large bin, hence reducing the “sharpness” of the signal.
Can I set the bin size to 1x1 ?
Furthermore I still do not see how I can import my grid data in the histogram directly, neither on how to use an external X/Y vectors.
Could you please give me simple example ?
My point was not on the file reading, but on the fact you are using TGraph2D on a regular data set. Moreover you are using the option “SURF2” to draw the graph, this option will create a 2D histogram and plot it with option surf2 so you are not gaining anything in “sharpness”. Even worst more, your result may lose in precision because TGraph2D uses the Delaunay triangles interpolation to fill the histogram which is a time consuming algorithm. That’s sound not optimal as you already have the data points on a regular grid.
The TH2D constructors are listed here: root.cern.ch/root/html/TH2D.html
I am afraid I still do not find an easy way to do the plot directly from the Histogram.
Maybe I have too much influence from Gnuplot’s pm3d option. It is a desperately simple one-liner: astri.uni.torun.pl/Manuals/g … de140.html
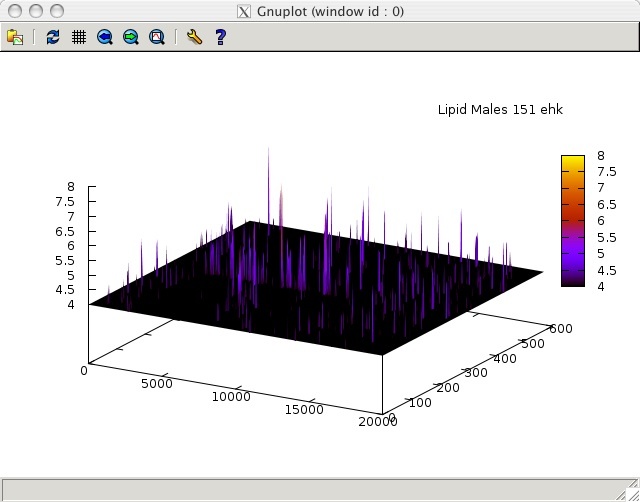
Below is the Gnuplot command I wanted to emulate:
splot "test.res" matrix with pm3d title "Lipid Males"
I’ve been following this conversation because I have almost exactly the same problem. I think my case is only different in that I want to read in multiple grid data into a tree.
Couet, were you able to solve the problem? if so could you post it in the forum please?
I did not get the informations I asked (in particular the axis limits). But seems to me there is no real problem. As it is data on a regular grid, a 2D histogram should be used. If you plot the result as a lego plot you will get something very similar to the plot shown here.
I want to read this into a tree so I can plot either the full x,y grid or any single row or column I choose . The original file has 120 rows x 170 columns. Could you use this data as your test data and post your script on the forum.
I’ve tried using the TTree::ReadFile command but I keep getting an output that shows only the 1st column.