I’m trying to draw a TGraph2D with the CONT1Z option, but the edges get cut off. When I set the axes to log scale, the issue is then amplified. Here’s two images showing linear vs log scale.
Can you post a running reproducer ? when I run your macro I get error messages like:
In file included from input_line_14:1:
/Users/couet/roottest/gbrown.C:10:36: error: use of undeclared identifier 'masses'
   TGraph2D* graph2 = new TGraph2D(masses.size(),masses.data(),mixings.data(),chisqr.data());
                                   ^
When you use histograms drawing option for TGraph2D the TGraph2D is not directly drawn but instead a 2D histogram is created from an interpolated on the 2D graph and then this histogram is plotted. The native option P, P0, or TRI plot the 2D graph directly. I will check your example .
The CONT1 option draws the contours lines connecting the bins’ centers. With log scale the X and Y do not have all the same surface like in linear scale. The cut you see comes from that but it is not related to TGraph2D. Any TH2 will be the same. May be draw your histogram with option COL instead.
I made an attempt at a solution by binning the underlying histogram with log scaled bins. It fixes the cutoff and the bins are spaced evenly now in the log scaled canvas, however it seems to have a lot of issues with the interpolation of the TGraph2D. I’ve found the SetNpx and SetNpy help a lot with the cutoff issue so I’ll stick with that for now, but here’s the code of my attempt. I don’t know if it is viable or not. Thanks for your time and help though.
void graph2d()
{
    TCanvas *c1 = new TCanvas("c1");

    c1->SetLogx();
    c1->SetLogy();
    //c1->SetLogz();

    Double_t rnd, x, y, z;
    Double_t e = 0.3;
    Int_t nd = 500;

    TRandom r;
    TF2  *f2 = new TF2("f2","1000*(([0]*sin(x)/x)*([1]*sin(y)/y))+200",-6,6,-6,6);
    f2->SetParameters(1,1);
    TGraph2D *dte = new TGraph2D(nd);

    // Fill the 2D graph
    for (Int_t i=0; i<nd; i++) {
        f2->GetRandom2(x,y);
        rnd = r.Uniform(-e,e); // Generate a random number in [-e,e]
        z = f2->Eval(x,y)*(1+rnd);
        dte->SetPoint(i,x,y,z);
    }

    double nbins = 60;
    std::vector<double> xbins(nbins+1), ybins(nbins+1);
    {
        double minx = 1;//dte->GetXmin();
        double maxx = dte->GetXmax();
        double miny = 1;//dte->GetYmin();
        double maxy = dte->GetYmax();
        double xstep = std::pow(maxx/minx, 1.0/nbins);
        double ystep = std::pow(maxy/miny, 1.0/nbins);
        for(int i = 0; i<=nbins; ++i)
        {
            xbins[i] = minx * std::pow(xstep, i);
            ybins[i] = miny * std::pow(ystep, i);
        }
    }
    TH2D* bins = new TH2D("bins", "", nbins, (double*)xbins.data(), nbins, (double*)ybins.data());
    bins->SetStats(false);
    dte->SetHistogram(bins);

    //dte->Draw("CONT1Z");
    dte->Draw("COL");
}
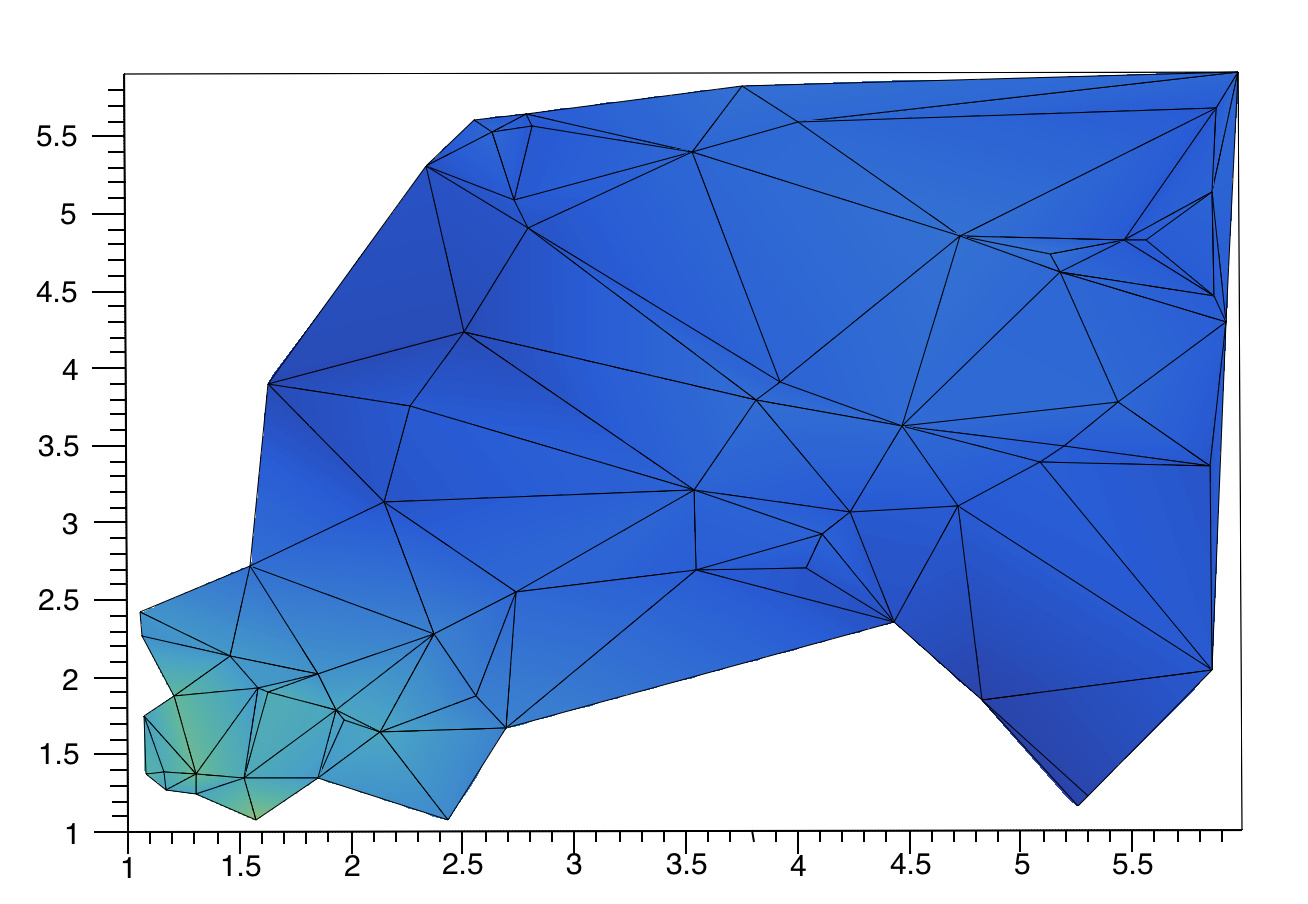
If I draw the Delaunay triangles corresponding to you TGraph2D (drawing option TRI1) I get the following picture As you can see they are far to cover the whole range. All the white zones are impossible to interpolate.
a workaround I used in the past for a similar issue (I was interested only in the x axis) is to populate the TGraph2D with log(xval), log(yval), zvalue, then draw the graph and set the plot axes so that they are not visible