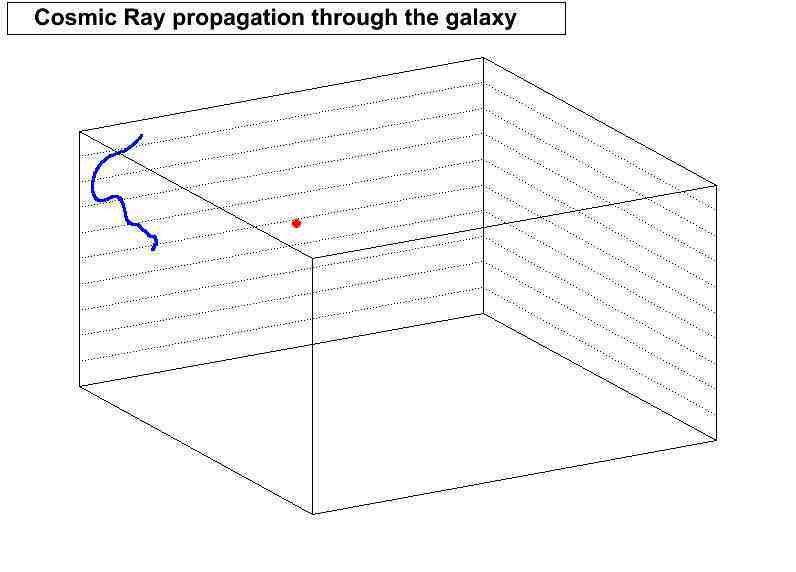
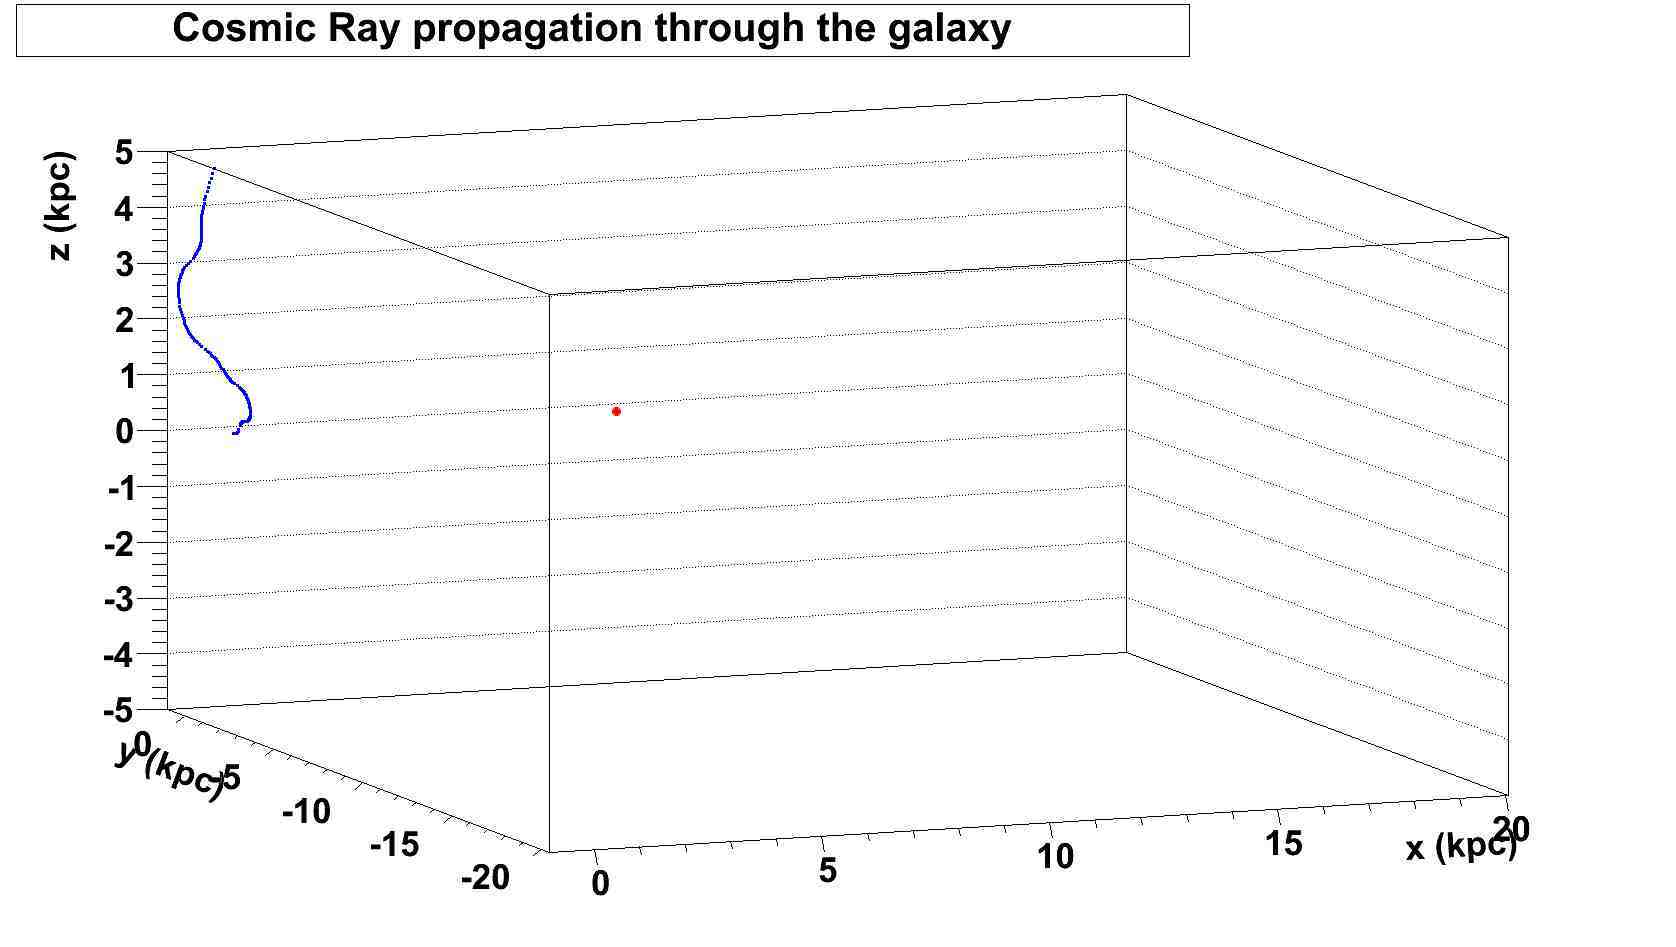
As the title suggests, when plotted, all 3 axes are left blank. I have settings on, so I’m not sure why this is happening.
Here is my code for when I create the TGraph2D’s and when I’m drawing it:
[code]
TGraph2D g_Prop;
TGraph2D earth;
g_Prop.SetTitle(“Cosmic Ray propagation through the galaxy;x (kpc);y (kpc);z (kpc)”);
earth.SetTitle(“Cosmic Ray propagation through the galaxy;x (kpc);y (kpc);z (kpc)”);
TApplication theApp(“app”, &argc, argv);
TCanvas c_Prop(“c_Prop”,“Cosmic Ray Propagation Through The Galaxy”, canvasX, canvasY);
g_Prop.SetMarkerColor(kBlue);
g_Prop.SetMarkerStyle(kFullDotMedium);
g_Prop.SetMarkerSize(1);
g_Prop.GetXaxis()->SetTitle(“x (kpc)”);
g_Prop.GetYaxis()->SetTitle(“y (kpc)”);
g_Prop.GetZaxis()->SetTitle(“z (kpc)”);
g_Prop.GetXaxis()->SetRangeUser(xmin,xmax);
g_Prop.GetYaxis()->SetRangeUser(ymin,ymax);
g_Prop.GetZaxis()->SetRangeUser(zmin,zmax);
g_Prop.Draw(“AP”);
earth.SetMarkerColor(kRed);
earth.SetMarkerStyle(kFullDotLarge);
earth.SetMarkerSize(1);
earth.GetXaxis()->SetRangeUser(xmin,xmax);
earth.GetYaxis()->SetRangeUser(ymin,ymax);
earth.GetZaxis()->SetRangeUser(zmin,zmax);
earth.GetXaxis()->SetTitle(“x (kpc)”);
earth.GetYaxis()->SetTitle(“y (kpc)”);
earth.GetZaxis()->SetTitle(“z (kpc)”);
earth.Draw(“P SAME”);
theApp.Run();
return(0); [/code]
and see the picture for the output.
The blue dots seen are randomised each run, so the propagation changes every time. Not sure if that has something to do with it; it shouldn’t. g_Prop is the TGraph2D containing the blue dots, whilst earth just contains the one point.
As you can see (hopefully, maybe), the axes are self-scaling, even though I have set limits for them (take my word for it!).
Notice I have also attempted to set the axis titles twice: Once in the SetTitle of the graph, and then separately on the canvas. Still to no avail.
I can’t show you the whole code, because in truth the code uses I think 4 or 5 other .cpp files, so it would be really long and messy. This means you can’t reproduce the plot, but I’m hoping what I have shown you will be enough.
If you need anymore information, please ask.
Any and all help is much appreciated.
Joshua