Hello,
again I’ve some troubles with TGraph2D performance. I try to show a function behavior just above its minimum, i.e. I need to cut the graph at some distance above the minimum. It is demonstrated by the following sample code
#include "TGraph2D.h"
#include "TStyle.h"
void test()
{
TGraph2D *g = new TGraph2D();
Int_t N = 0;
for (Double_t x = 0.; x <= 10.; x+=0.5) {
for (Double_t y = 0.; y <= 10.; y+=0.5) {
g->SetPoint(N, x, y, sin(x-y));
N++;
}
}
gStyle->SetPalette(51);
g->GetZaxis()->SetRangeUser(-1., -.5);
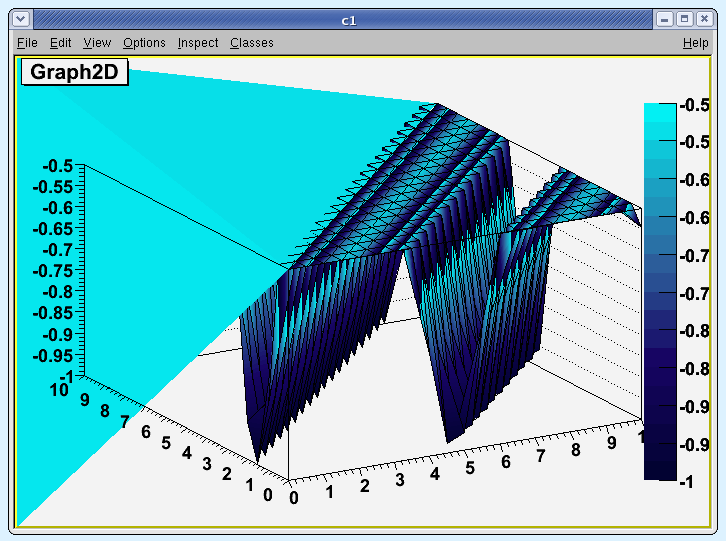
g->Draw("tri1z");
}The result is weird, see the attachment. Actually, the light blue area on the left is not the major issue since it doesn’t appear in real situations. The problem is the colors in the figure don’t agree with the scale on the right. Extremely ill is the plain of the cut (i.e. z=-0.5). I’d expect it to be drawn by one color, but it is not the case.
Please could you help me get some more reasonable output. Thanks in advance,
Kaspi.