Hi everybody,
I have had quite a lot of pain to get TGraph2D producing the graph I had in mind.
But there are a few open questions… I’d be very thankful for pointing out mistakes or giving suggestions .
What I wanted to do is to generate a 2D color filled contour plot x*y where z is color axis.
The data constists of not-equidistant datapoints (the example code uses artificial data).
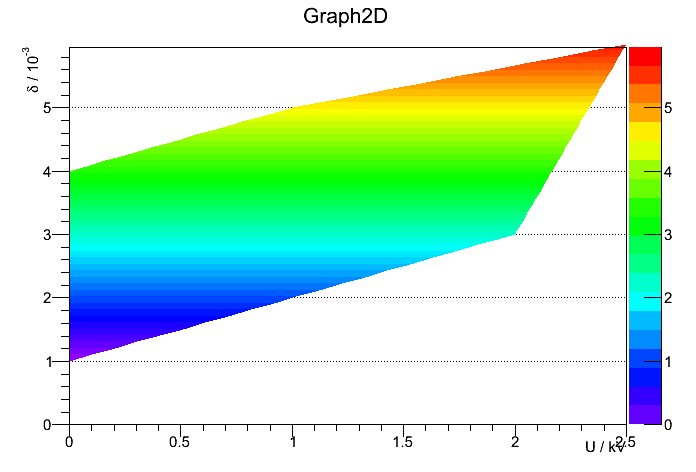
This worked quite well by using TGraph2d, the drawing option TRI2Z and rotating the canvas for the impression of a 2D graph.
problem 1:
I was not able to access the axis ranges or titles:
[code]#include <TCanvas.h>
#include <TAxis.h>
#include <TGraph2D.h>
#include <TH2.h>
int TGraph2D_example(){
double x[6] = {0,0.5,2,0,1,2.5};
double y[6] = {0,1.0,0.5,1,3,4};
double z[6] = {1,2,3,4,5,6};
TGraph2D *g = new TGraph2D();
for (int i = 0; i<6; i++) {
g->SetPoint(i,x[i],y[i],z[i]);
}
TCanvas *c1 = new TCanvas(“c1”);
c1->cd();
g->Draw(“TRI2 Z”);
g->GetXaxis()->SetTitle(“U / kV”);
g->GetYaxis()->SetTitle(“I / #muA”);
g->GetZaxis()->SetTitle("#delta / 10^{-3}");
c1->SetTheta(90.0-0.001);
c1->SetPhi(0.0+0.001);
c1->SetRightMargin(0.17);
c1->SetLeftMargin(0.125);
c1->Modified();
c1->Update();
c1->Print(“TGraph2D_example1.png”);
return(0);
}[/code]
gave the following result:
The strange thing here is, that pasting the same code in the interactive console (not compiling it…) gave the result I wanted (more or less).
I tried to plot a defined frame and then overplot the TGraph2D with the SAME option.
This kind of worked, but I ended up being able to access XY axis but not Z.
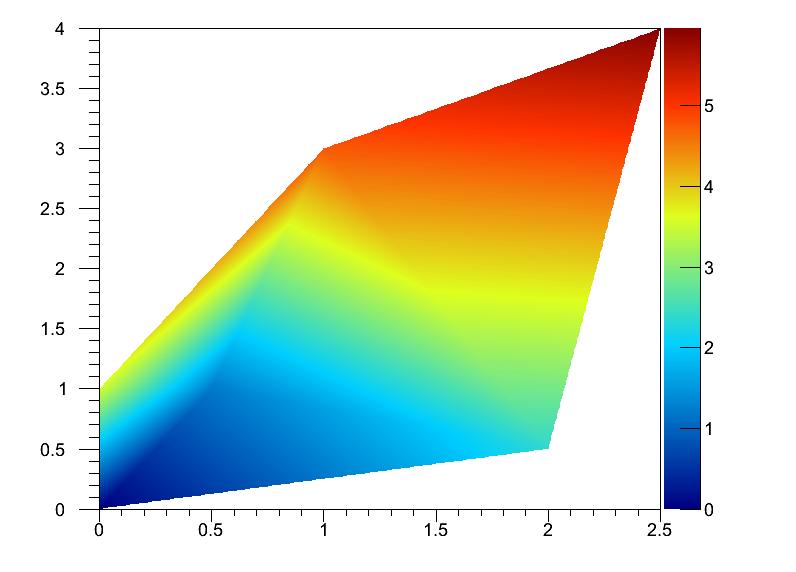
Then I found the SetHistogram() option…
I am not sure why I was able the access the axis by this trick.
[code]#include <TCanvas.h>
#include <TAxis.h>
#include <TGraph2D.h>
#include <TH2.h>
int TGraph2D_example(){
double x[6] = {0,0.5,2,0,1,2.5};
double y[6] = {0,1.0,0.5,1,3,4};
double z[6] = {1,2,3,4,5,6};
TGraph2D *g = new TGraph2D();
TH2D *h = new TH2D(“h”,"",100,0,3,100,0,4);
for (int i = 0; i<6; i++) {
g->SetPoint(i,x[i],y[i],z[i]);
}
TCanvas *c1 = new TCanvas(“c1”);
c1->cd();
g->SetHistogram(h);
g->Draw(“TRI2 Z”);
g->GetXaxis()->SetTitle(“U / kV”);
g->GetYaxis()->SetTitle(“I / #muA”);
g->GetZaxis()->SetTitle("#delta / 10^{-3}");
c1->SetTheta(90.0-0.001);
c1->SetPhi(0.0+0.001);
c1->SetRightMargin(0.17);
c1->SetLeftMargin(0.125);
c1->Modified();
c1->Update();
c1->Print(“TGraph2D_example.pdf”);
return(0);
}[/code]
Now the graph looked like this:

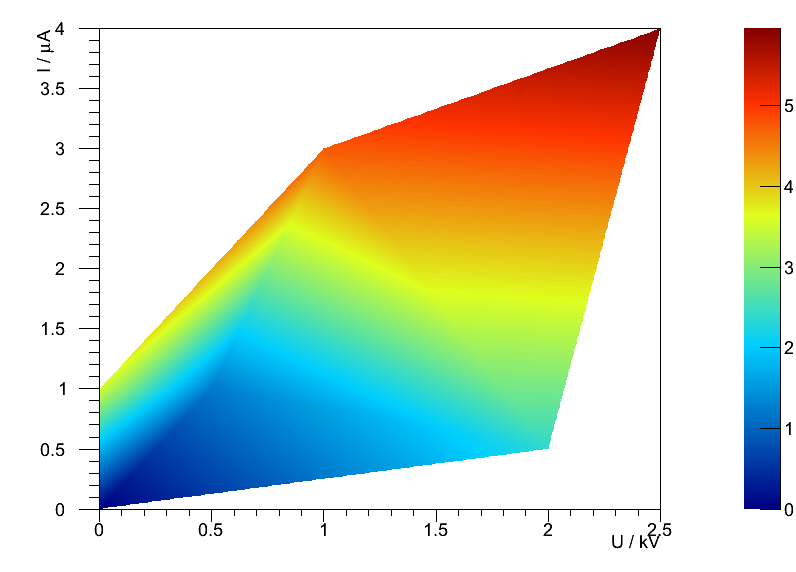
problem 2:
The next thing I encountered was the color bar on the right being out of sync with the colors used for the left plot. This can be visualized by rotating the canvas:

So what I did was setting minimum and maximum manually.
[code]#include <TCanvas.h>
#include <TAxis.h>
#include <TGraph2D.h>
#include <TH2.h>
int TGraph2D_example(){
double x[6] = {0,0.5,2,0,1,2.5};
double y[6] = {0,1.0,0.5,1,3,4};
double z[6] = {1,2,3,4,5,6};
TGraph2D *g = new TGraph2D();
TH2D *h = new TH2D(“h”,"",100,0,3,100,0,4);
for (int i = 0; i<6; i++) {
g->SetPoint(i,x[i],y[i],z[i]);
}
TCanvas *c1 = new TCanvas(“c1”);
c1->cd();
g->SetHistogram(h);
g->Draw(“TRI2 Z”);
g->GetXaxis()->SetTitle(“U / kV”);
g->GetYaxis()->SetTitle(“I / #muA”);
g->GetZaxis()->SetTitle("#delta / 10^{-3}");
g->SetMinimum(g->GetZmin());
g->SetMaximum(g->GetZmax());
c1->SetTheta(90.0-0.001-90);
c1->SetPhi(0.0+0.001);
c1->SetRightMargin(0.17);
c1->SetLeftMargin(0.125);
c1->Modified();
c1->Update();
c1->Print(“TGraph2D_example5.png”);
return(0);
}[/code]
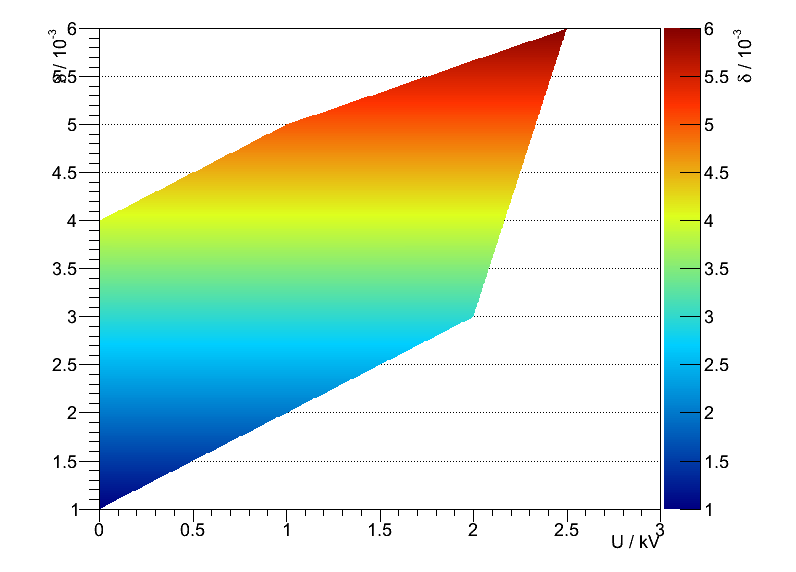
Is behavior generated intentionally?
Thanks in advance for any help or hints,
Markus
I am using ROOT 5.34/03 (branches/v5-34-00-patches@46829, Nov 25 2012, 12:10:00 on linuxx8664gcc)
I tested it with the SVN version, which seemed to have no effect.