ROOT Version: ROOT 6.22/02
Platform: Red Hat Enterprise Linux Server 7.9 (Maipo)
Compiler: g++ (GCC) 4.8.5 20150623 (Red Hat 4.8.5-44)
I’m struggling to make a TGraph with TDatime on the x axis. Here is my minimal working example:
#include <chrono>
#include <iostream>
#include <thread>

#include "TAxis.h"
#include "TCanvas.h"
#include "TDatime.h"
#include "TFile.h"
#include "TGraph.h"
#include "TTree.h"

void make_tree() {

  TFile* file = new TFile("output.root", "RECREATE");
  TTree* tree = new TTree("tree", "");

  TDatime* date_time = new TDatime();
  tree->Branch("date_time", &date_time);
  double value = 0;
  tree->Branch("value", &value, "value/D");

  for (int i = 0; i < 5; ++i) {
    date_time->Set();
    date_time->Print();
    value = i;
    tree->Fill();
    std::this_thread::sleep_for(std::chrono::seconds(1));
  }

  tree->Write();
  file->Close();

}

void read_tree() {

  TFile* file = new TFile("output.root", "READ");
  TTree* tree = (TTree*) file->Get("tree");

  TDatime* date_time = nullptr;
  tree->SetBranchAddress("date_time", &date_time);
  double value = 0;
  tree->SetBranchAddress("value", &value);

  std::vector<float> date_times;
  std::vector<float> values;

  for (int i = 0; i < tree->GetEntries(); ++i) {
    tree->GetEntry(i);
    date_time->Print();
    date_times.push_back(date_time->Convert());
    values.push_back(value);
  }

  TGraph* graph = new TGraph(date_times.size(),
			     &(date_times[0]),
			     &(values[0]));

  TCanvas* canvas = new TCanvas("canvas", "canvas");
  graph->GetXaxis()->SetTimeDisplay(1);
  graph->GetXaxis()->SetNdivisions(502);
  graph->GetXaxis()->SetTimeFormat("%Y-%m-%d %H:%M:%S");
  graph->GetXaxis()->SetTimeOffset(0);
  graph->SetMarkerStyle(20);
  graph->Draw("AP");

}
This is how I run the script:
-bash-4.2$ root -l
root [0] .L make_and_read_tree.C++g
Info in <TUnixSystem::ACLiC>: creating shared library /path/to/file/./make_and_read_tree_C.so
root [1] make_tree()
Date/Time = Thu Dec 10 13:54:42 2020
Date/Time = Thu Dec 10 13:54:43 2020
Date/Time = Thu Dec 10 13:54:44 2020
Date/Time = Thu Dec 10 13:54:45 2020
Date/Time = Thu Dec 10 13:54:46 2020
root [2] read_tree()
Date/Time = Thu Dec 10 13:54:42 2020
Date/Time = Thu Dec 10 13:54:43 2020
Date/Time = Thu Dec 10 13:54:44 2020
Date/Time = Thu Dec 10 13:54:45 2020
Date/Time = Thu Dec 10 13:54:46 2020
root [3]
Here is the output:
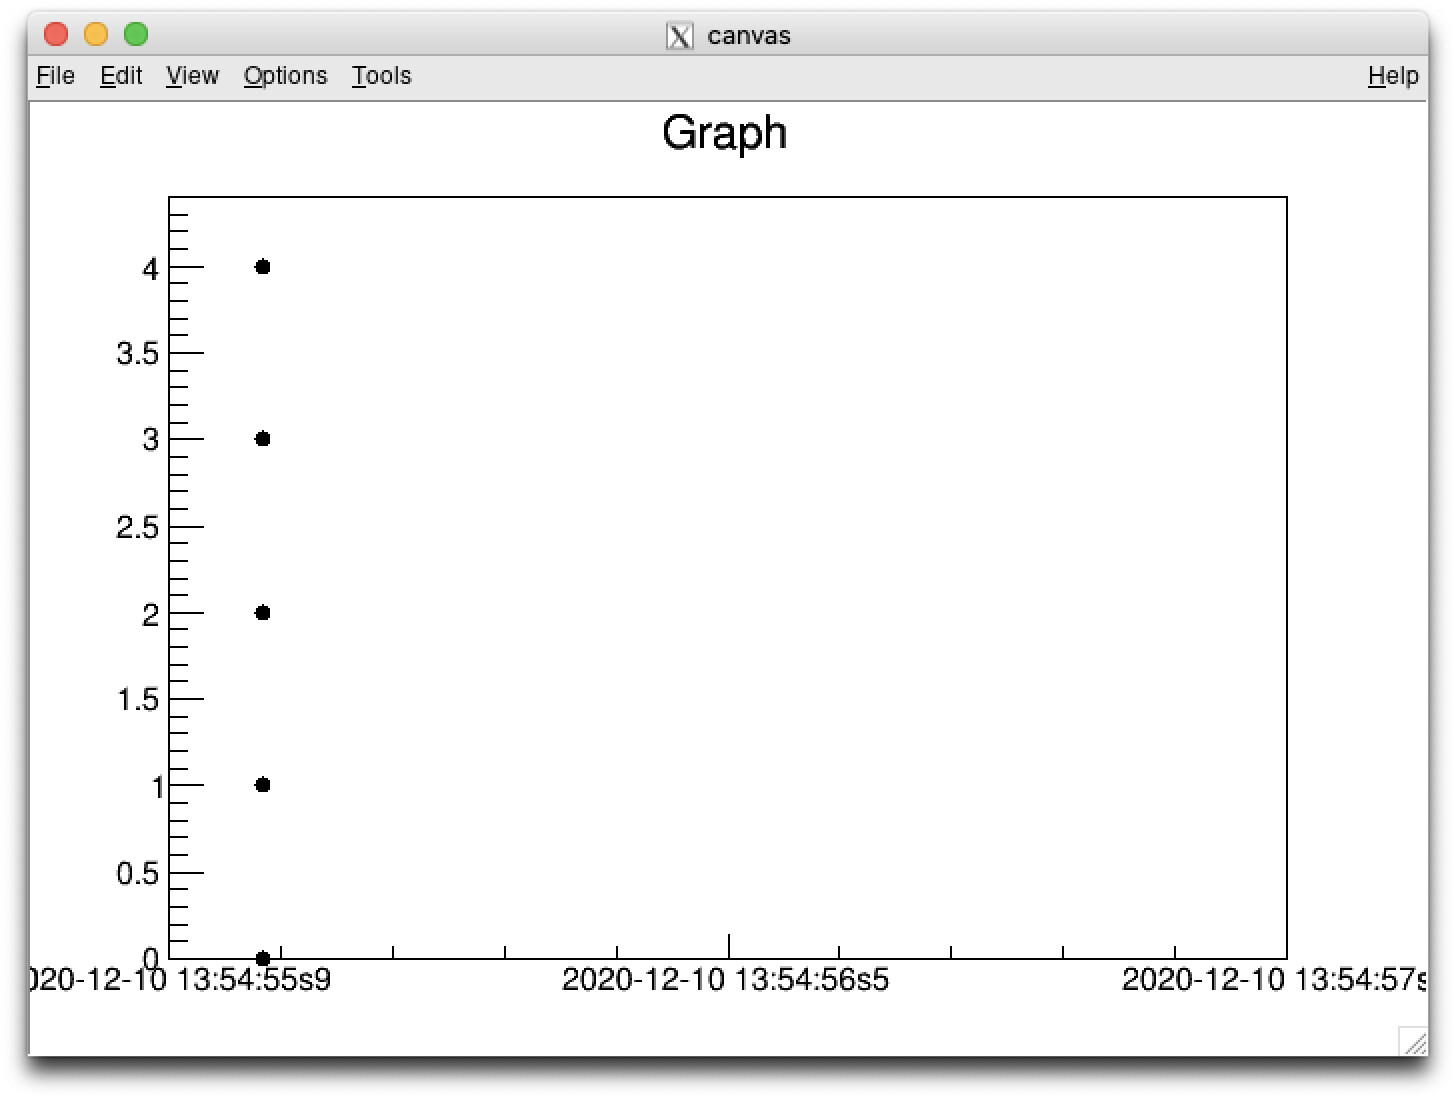
This is not what I expect. The date/times in the x axis are close to what they should be. Not sure what the “s” is doing after the seconds in the x axis. Any help would be greatly appreciated. Also, as far as I can tell, the line
graph->GetXaxis()->SetTimeOffset(0); only changes the year from 2045 to 2020. Is this correct? I didn’t understand the documentation.