Hi everyone,
I am plotting a graph with double Y axis and string values on the X axis, but along the x axis the values aren’t displayed. It just shows one of them at the end. Any idea how to solve this?
void plot(){
std::vector<Double_t> y_vals;
std::vector<std::string> x_labels;
std::vector<Double_t> y2_vals;
auto c=new TCanvas();
c->SetGrid();
// Fill the vectors here
std::ifstream file ("data40K.txt");
if(!file){
cout << "File doesn't exist" << endl;
    }
std::string x;
double x2, y, y2;


while(!file.eof()){
file >> x >> y >> x2 >> y2;
x_labels.push_back(x);
y_vals.push_back(y);
y2_vals.push_back(y2);
                }
//fill the Graphs
c->cd();
TGraph* tg = new TGraph(TMath::Min(y_vals.size(), x_labels.size())); // Create the TGraph object

for (Int_t i = 0; i < TMath::Min(y_vals.size(), x_labels.size()); i++) { // Loop over all entries
    tg->SetPoint(i, i + 1., y_vals[i]); // Set The point itself
    tg->GetXaxis()->SetBinLabel(tg->GetXaxis()->FindBin(i + 1.), x_labels[i].c_str()); // Find out which bin on the x-axis the point corresponds to and set t
}

TGraph* tg2 = new TGraph(TMath::Min(y2_vals.size(), x_labels.size())); // Create the TGraph object

for (Int_t i = 0; i < TMath::Min(y2_vals.size(), x_labels.size()); i++) { // Loop over all entries
    tg2->SetPoint(i, i + 1., y2_vals[i]); // Set The point itself
    tg2->GetXaxis()->SetBinLabel(tg2->GetXaxis()->FindBin(i + 1.), x_labels[i].c_str()); // Find out which bin on the x-axis the point corresponds to and set
}


// Draw the plots
tg->SetMarkerStyle(7);
tg2->SetMarkerStyle(8);
tg2->SetMarkerColor(kBlue);
tg2->SetLineColor(kBlue);

tg2->GetYaxis()->SetLabelColor(kBlue);

tg2->GetYaxis()->SetTitleOffset(1.4);
tg2->GetYaxis()->SetTitle("y2-title");
tg->GetYaxis()->SetTitle("y1-title");
tg->GetXaxis()->SetTitle("x1-title");

TPad *pad1 = new TPad("pad1","",0,0,1,1);
TPad *pad2 = new TPad("pad2","",0,0,1,1);
pad2->SetFillStyle(4000); //will be transparent
pad2->SetFrameFillStyle(0);

pad1->Draw();
pad1->cd();
tg->Draw("ALP"); // Draw the TGraph

pad2->Draw();
pad2->cd();
tg2->Draw("ALPY+"); //sets the axis/labels on the opposite side
c->Update();
}
data40K.txt (965 Bytes)
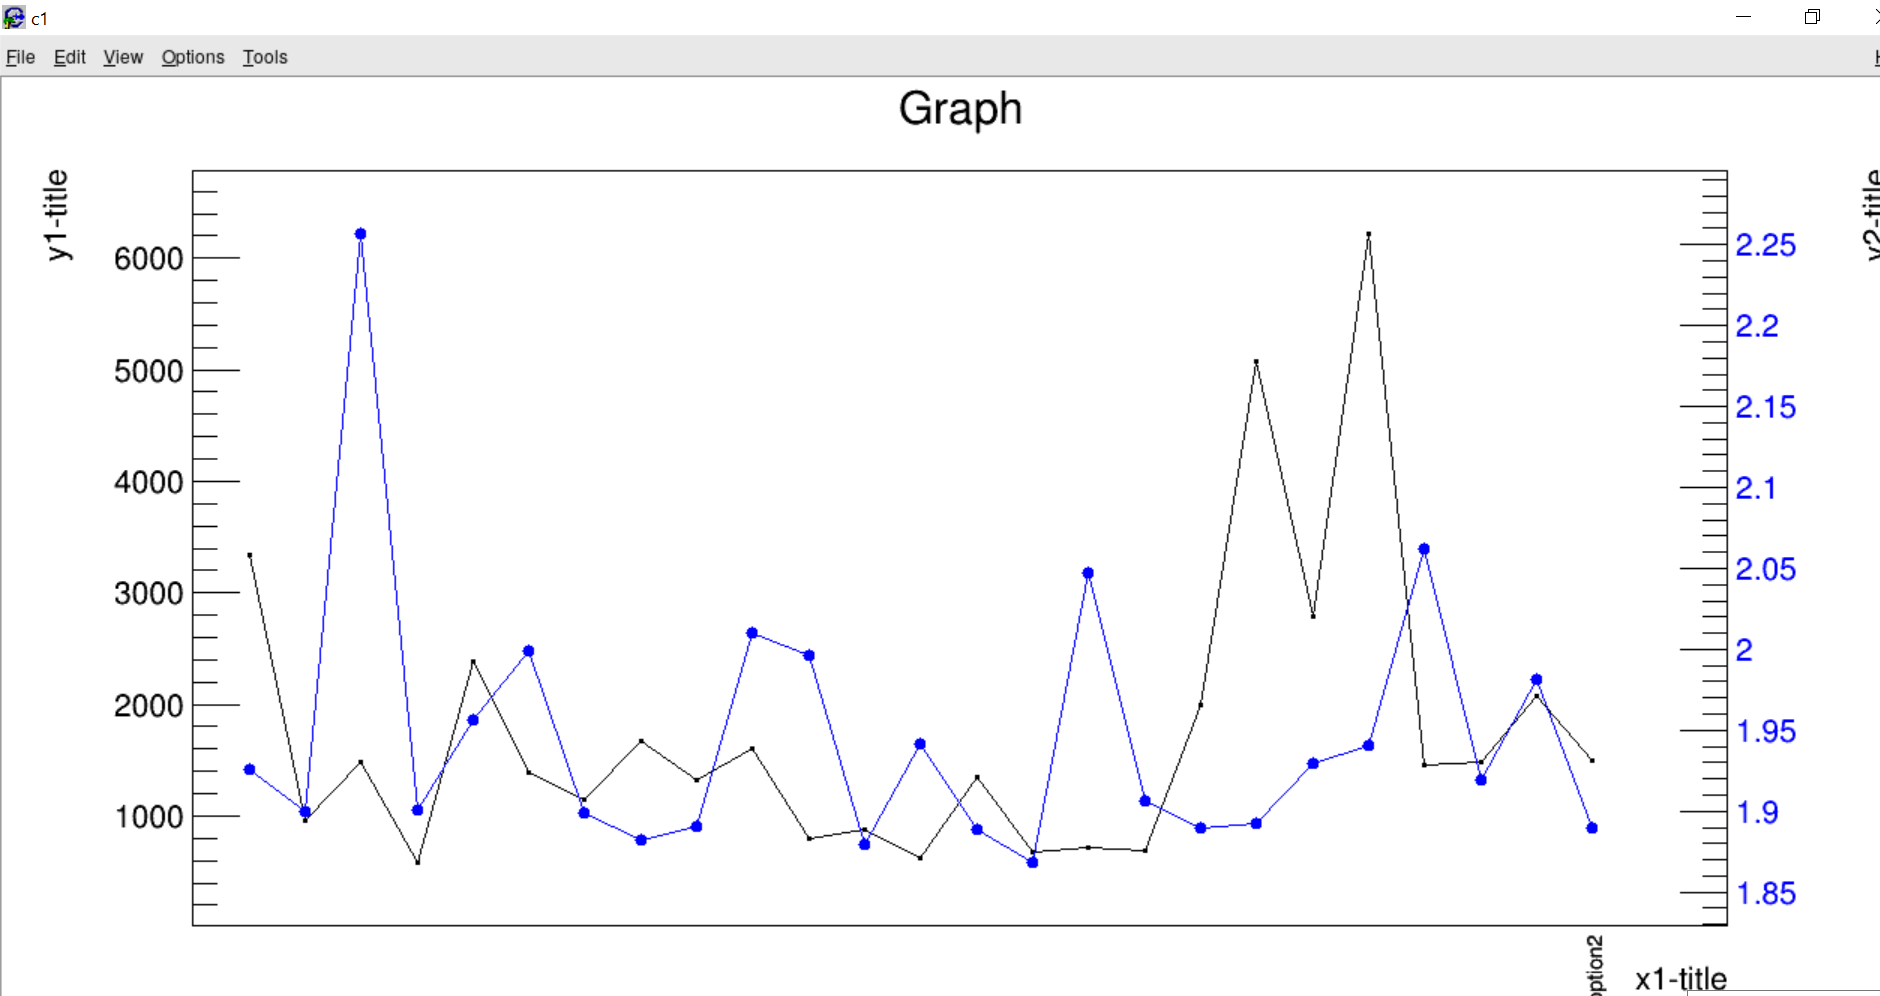
It draws the plot like this:
But I need it to be something like this:
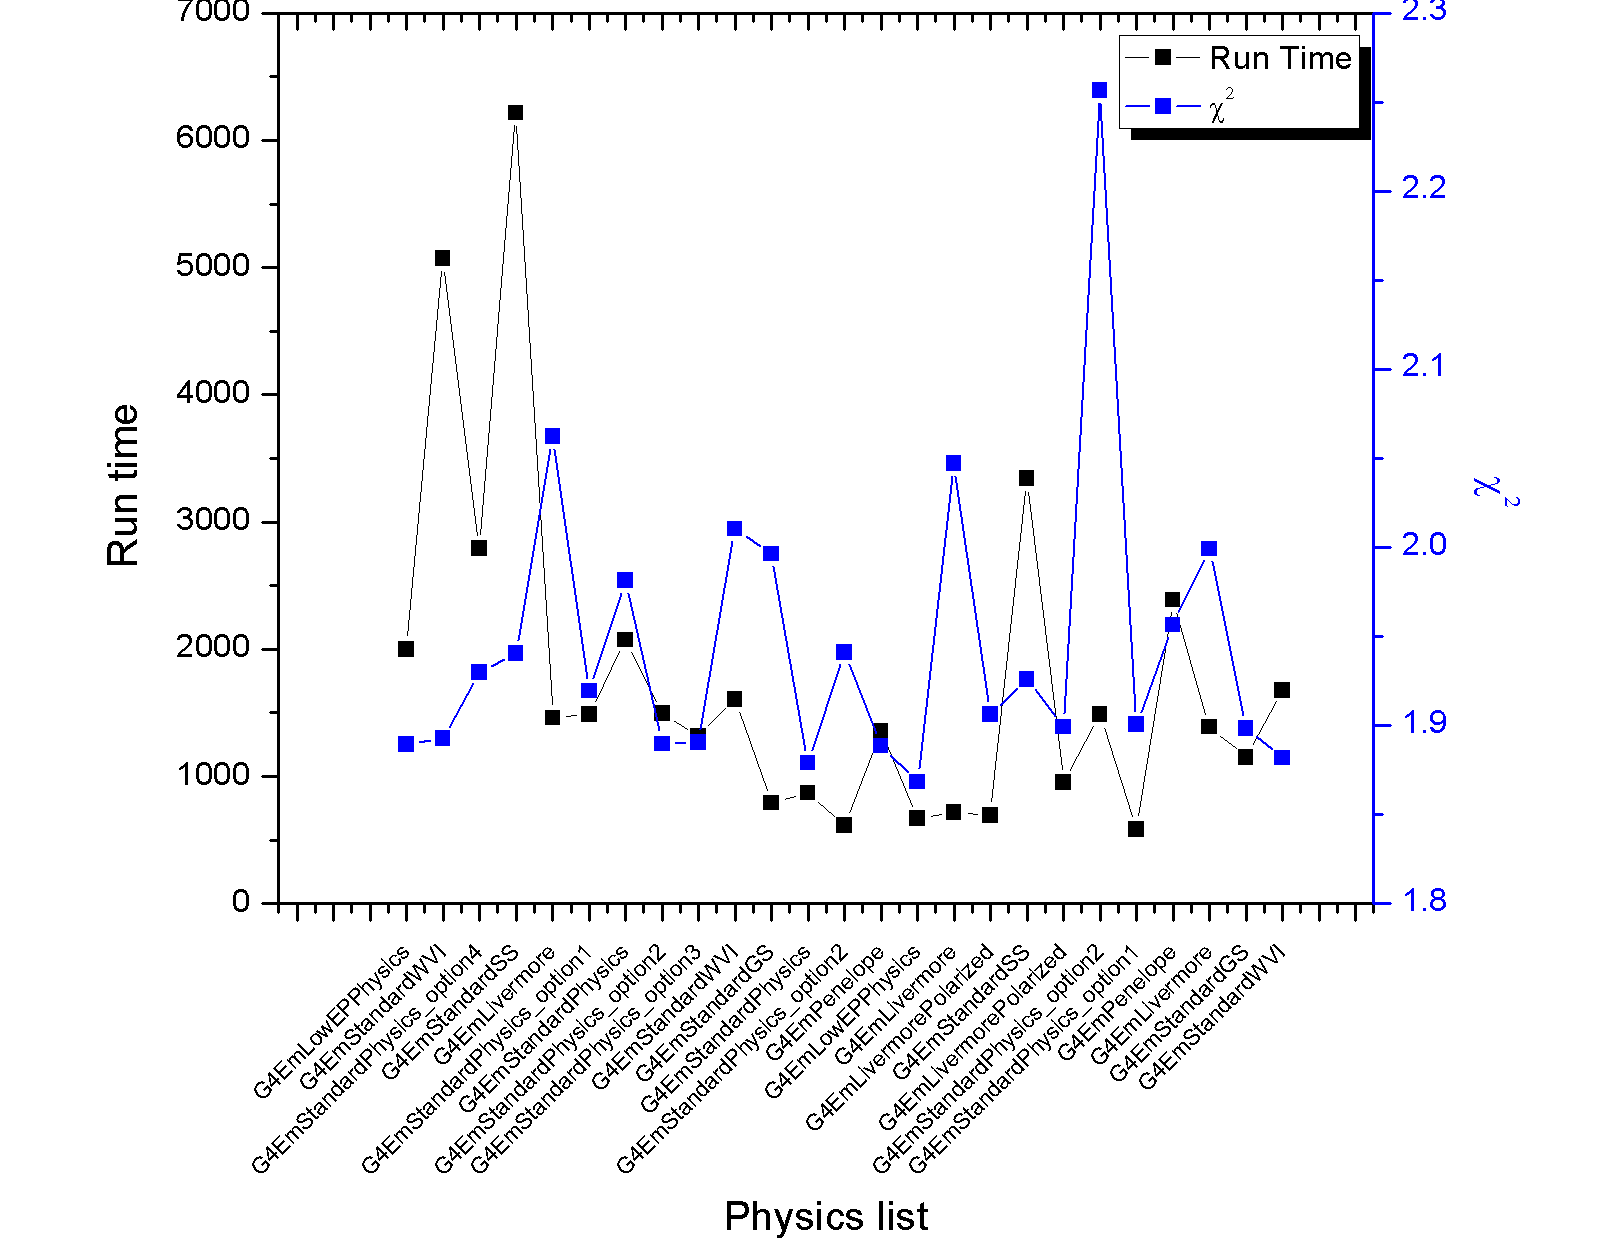
Thank you for help!