Hello there,
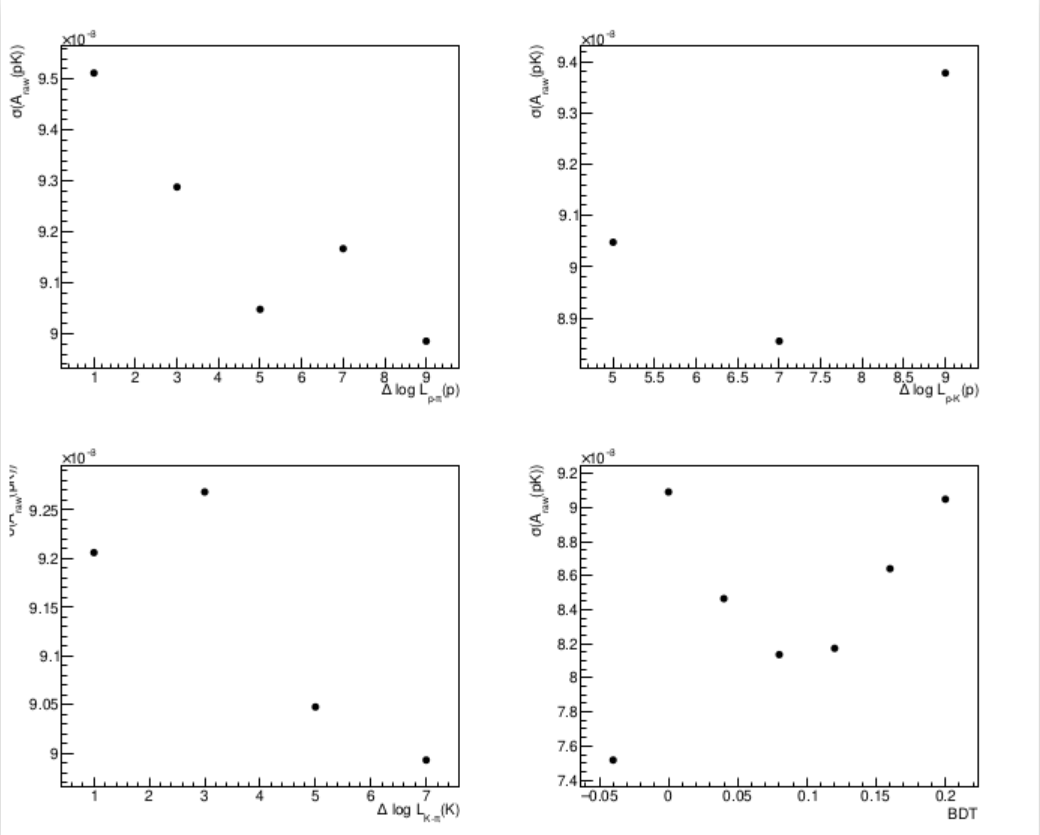
I’m trying to draw some data but i’m having some issues with setting the maximum number of digits for the axis (for example see bottom left corner of the attached figure).
I get this error randomly on 4 graphs, and the relevant part of the code looks like this, even if i call on the y axis g1->GetYaxis()->SetMaxDigits(2); i sometimes get axis with 3 or even more digits and this forces the y axis title out of the canvas.
Do you know how i could either force the axis to always give me 2 digits or move the graphs on the left hand column a bit to the right in order to not have the y axis title cut in half?
Thanks in advance!
void errplot(TString channel = "pk", TString bdtCut = "0.0", TString configuration = "3.3.3.-3"){
  using namespace std;
  using namespace RooFit;
  TString pidEffs_dir = "path/";
  TString pidEffs_name = pidEffs_dir + "/pidEffs_"+ bdtCut+ "_"+configuration+".root";
  TFile *pidEffs_file = new TFile(pidEffs_name, "READ");
  int pid1 = ((TObjString *) configuration.Tokenize(".")->At(0))->String().Atoi();
  int pid2 = ((TObjString *) configuration.Tokenize(".")->At(1))->String().Atoi();
  int pid3 = ((TObjString *) configuration.Tokenize(".")->At(2))->String().Atoi();
  int pid4 = ((TObjString *) configuration.Tokenize(".")->At(3))->String().Atoi();
  float bdt = bdtCut.Atof();
  TCanvas * c = new TCanvas("c", "c", 2200, 1800);

  c->Divide(2,2);
  c->cd(1);

  ///////////////////////////////1
  //TPad c1 = new TPad();
  auto g1 = new TGraph();
  g1->SetLineWidth(0);
  g1->SetMarkerStyle(20);
  g1->SetMarkerSize(2);

  for(int pid1var:{1,3,5,7,9}){
    if(channel == "pk" ||(channel == "ppi" && pid4 <= pid1var)){
    TString currentConfiguration = Form("%s_%d.%d.%d.%d", bdtCut.Data(), pid1var, pid2, pid3, pid4);
    double sum=0;
    TString toyResFile=Form("/path/toy_%s_%s.root", channel.Data(), currentConfiguration.Data());
    TFile * file = new TFile(toyResFile, "READ");
    for(int i = 0;i<10;i++){

      TString nome_result = Form("result_0%d", i);
      auto result = (RooFitResult*)file->Get(nome_result);
      auto l = result->floatParsFinal();
      auto var = (RooRealVar*)l.at(2);
      double err = var->getError();
      sum+=err;
    }
    double mean = sum/10;
    g1->AddPoint(pid1var, mean);
    file->Close();
    }}
    if(channel == "pk"){  g1->SetTitle(";#Delta log L_{p-#pi}(p); #sigma(A_{raw}(pK))");}
  else if(channel == "ppi"){  g1->SetTitle(";#Delta log L_{p-#pi}(p); #sigma(A_{raw}(p#pi))");}
  g1->GetYaxis()->SetMaxDigits(2);
  g1->GetYaxis()->SetLabelSize(0.04);
  g1->GetXaxis()->SetLabelSize(0.04);
  g1->GetXaxis()->SetTitleSize(0.04);
  g1->GetYaxis()->SetTitleSize(0.04);

  g1->Draw();

  TString plot_name = Form("plots/plot_acperr_%s_%s_%s.pdf", channel.Data(), bdtCut.Data(), configuration.Data());
  c->SaveAs(plot_name);
}
ROOT Version: 6.26/00
Built for linuxx8664gcc