You haven’t declared the arrays properly. Pointers can be dangerous if used incorrectly, I’d suggest using vectors. Print the points in the graph and you will see they are random values from memory (besides the first which is the only memory address you actually set):
gr->Print();
yields:
Info in <TCanvas::MakeDefCanvas>:  created default TCanvas with name c1
x[0]=4.51, y[0]=0.00496534
x[1]=1.73061e-77, y[1]=-3.1111e+231
x[2]=6.95255e-310, y[2]=3.10504e+231
x[3]=2.6868e+154, y[3]=6.95255e-310
x[4]=6.95255e-310, y[4]=2.55333e+151
x[5]=0, y[5]=6.01666e+151
x[6]=6.95255e-310, y[6]=1.92102e+170
x[7]=2.18877e-314, y[7]=7.33729e+223
x[8]=6.95255e-310, y[8]=1.27951e+199
x[9]=6.95255e-310, y[9]=1.72632e-306
x[10]=2.122e-314, y[10]=6.95255e-310
x[11]=6.95255e-310, y[11]=-4.34373e-311
x[12]=6.95255e-310, y[12]=2.52962e-321
x[13]=6.95255e-310, y[13]=6.95255e-310
x[14]=0, y[14]=6.95255e-310
x[15]=0, y[15]=6.95255e-310
x[16]=6.95255e-310, y[16]=6.95314e-310
x[17]=6.95255e-310, y[17]=0
x[18]=6.95255e-310, y[18]=6.95251e-310
x[19]=6.95255e-310, y[19]=6.95255e-310
x[20]=6.95255e-310, y[20]=2.122e-314
x[21]=6.95255e-310, y[21]=6.95255e-310
x[22]=6.95255e-310, y[22]=0
x[23]=6.95255e-310, y[23]=2.18872e-314
x[24]=6.95255e-310, y[24]=6.95255e-310
x[25]=6.95255e-310, y[25]=6.95255e-310
x[26]=-3.1111e+231, y[26]=2.68156e+154
x[27]=-2.00391, y[27]=6.95255e-310
x[28]=6.95255e-310, y[28]=8.09625e-320
x[29]=6.95255e-310, y[29]=6.95255e-310
x[30]=6.95255e-310, y[30]=0
x[31]=2.18877e-314, y[31]=0
x[32]=6.95255e-310, y[32]=0
x[33]=6.95255e-310, y[33]=0
x[34]=2.122e-314, y[34]=6.95255e-310
x[35]=6.95255e-310, y[35]=6.95255e-310
x[36]=6.95255e-310, y[36]=6.95255e-310
x[37]=6.95255e-310, y[37]=6.95255e-310
x[38]=0, y[38]=6.95255e-310
x[39]=6.95255e-310, y[39]=6.95255e-310
x[40]=3.1111e+231, y[40]=6.95255e-310
x[41]=-1.29075e-231, y[41]=6.95255e-310
x[42]=9.88131e-324, y[42]=0
x[43]=3.4766e-309, y[43]=0
x[44]=6.95255e-310, y[44]=3.39519e-313
x[45]=6.95255e-310, y[45]=6.95255e-310
x[46]=6.95255e-310, y[46]=6.95251e-310
x[47]=2.18877e-314, y[47]=1.8774e-308
x[48]=6.95255e-310, y[48]=6.95255e-310
x[49]=6.95255e-310, y[49]=-1.15331e-291
x[50]=2.12433e-314, y[50]=6.95255e-310
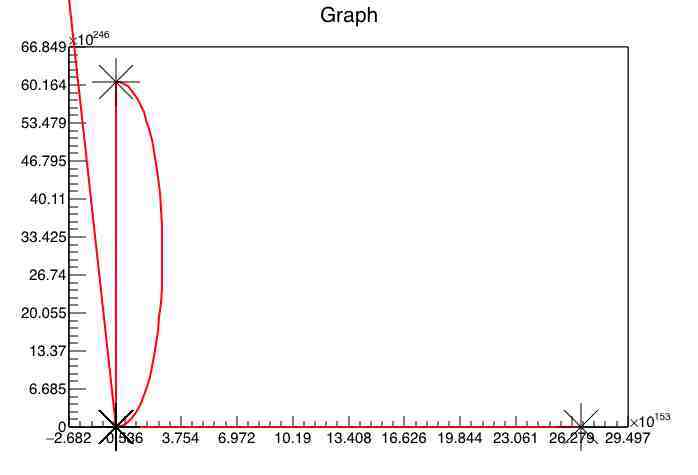
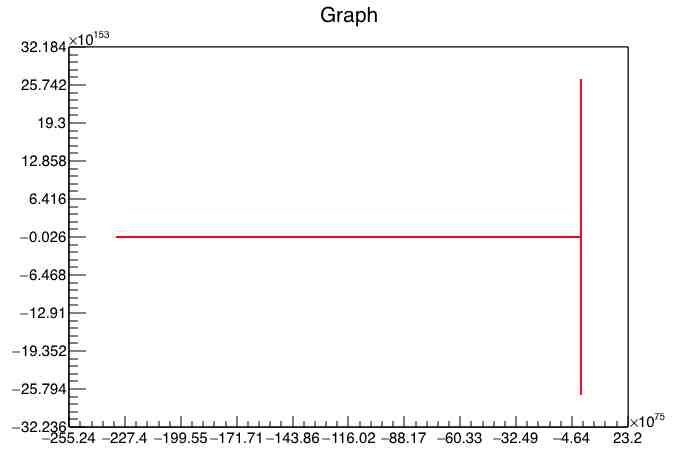
It does make some fun plots though:
Could you explain the goal of the plot? I can’t even guess from your code what you would like to be plotting.