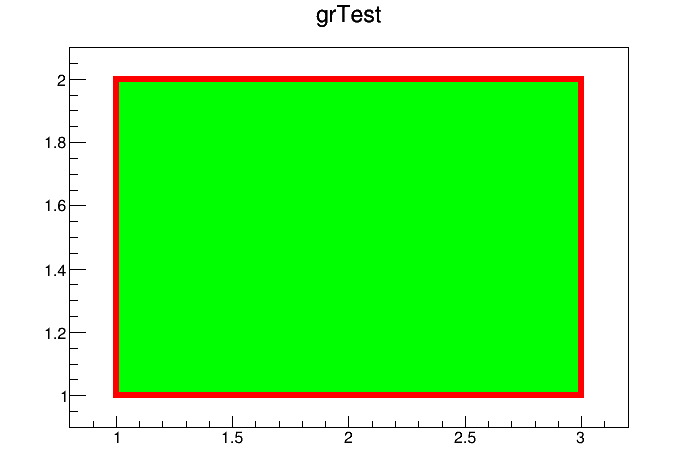
I would like to fill a TGraph polygon with a color from a specified gStyle->Palette(), as in the short example below. The problem seems to be that when I change the Palette() from default to e.g. Viridis, my graph line and fill colors don’t change. I tried with plotting option “f” and “pfc”, in TGraph and in TH1D, in Root versions 6.24 and 6.22 .
Apologies if this problem has an obvious solution that I am missing. Thanks in advance.
The TGraph plotting never use the palette.
What do you expect ? you have 5 points connected by a line. How the palette should be used ? I have no idea.
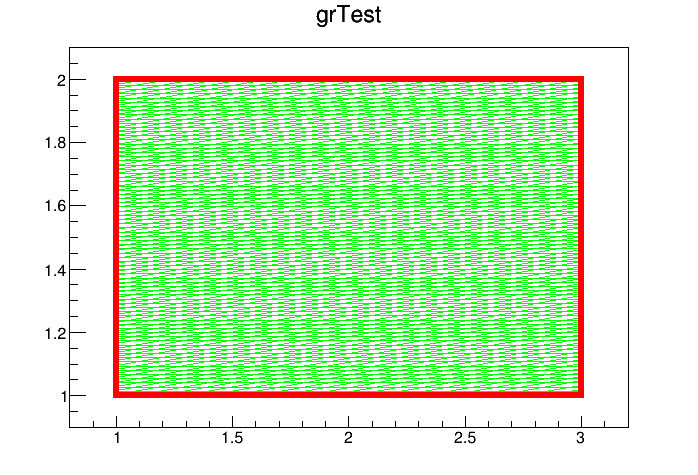
I tried “A L F PFC” and was still not able to get the graph to acknowledge gStyle->SetPalette(). I was able to change the fill style with grTest->SetFillStyle(3201), below.
I am trying to depict energy depositions into crystals with a color heat-map. Each crystal is represented as a polygon (rectangle defined by 5 points). The polygon gets filled with a color if it gets hit in my simulation. It would be great if the color could show how much energy got deposited into the crystal.
Hi @slocum ,
do I understand correctly that you want to change grTest->SetFillColor(3) in your original snippet to grTest->SetFillColor(ColorFromPaletteForValue(intensity)); where intensity can be, say, from 0 to 100 and ColorFromPaletteForValue should return a different color depending on intensity selecting it from a color palette?
If that’s the case, see the example using TColor::CreateGradientColorTable() here: ROOT: TColor Class Reference .
Hi @eguiraud , yes that is exactly what I was trying to do. And, I was able to find a solution using the link that you suggested. Thank you very much! The working code snippet is below.