Hi there,
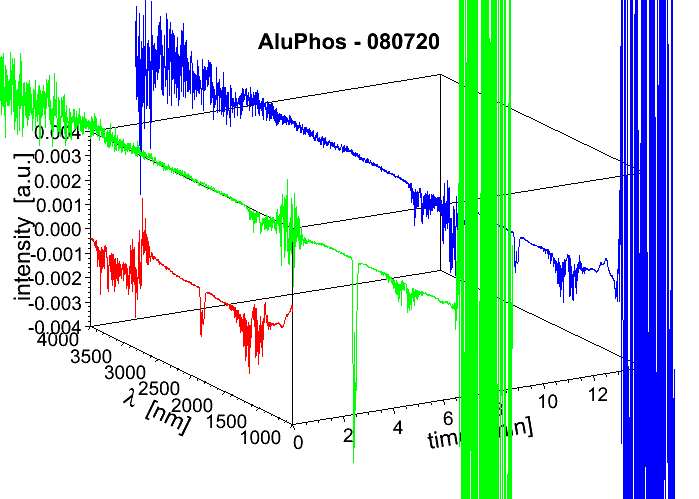
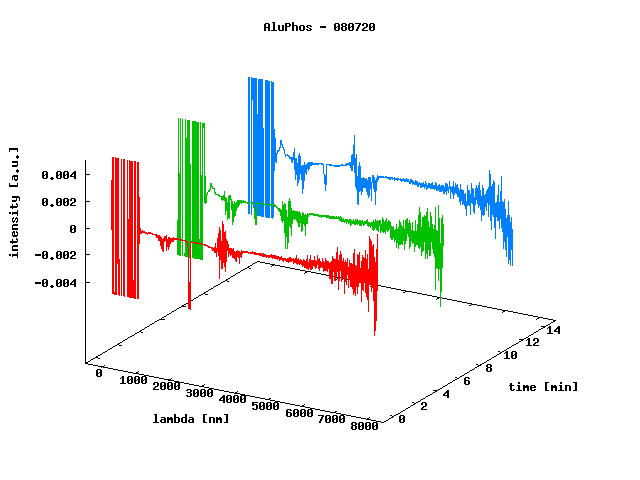
I’d like to plot several graph in 3D like in the following fig (gnuplot).
I’ve tried to play with TGraph & TGraph2D, in vain.
Could you please tell me how to proceed ?
Thanks a lot,
Z
Hi there,
I’d like to plot several graph in 3D like in the following fig (gnuplot).
I’ve tried to play with TGraph & TGraph2D, in vain.
Could you please tell me how to proceed ?
Thanks a lot,
Z
There is no direct way to obtain “exactly” this right now.
Could it be scheduled in a near future ?
What would be the closer thing that can be achieved meanwhile ?
Thanks, Z
And by the way, could it be also possible to implement TGraph::DrawPanel() quite soon ? ![]()
Cheers, Z
give me time to reply your other question… and do not mix requests !!! Please !!
okay, i’m sorry
![]()
Here is a way to produce the 3D graphs you asked. This example uses TPolyLine3D. You should copy your TGraphs into TPolyLine3Ds (a simple loop).
{
   TCanvas *c1=new TCanvas("c1","c1",800,600);
   TH3F* h3 = new TH3F("h3", "h2", 10, 0, 14, 10, 0, 8000, 10, -0.004, 0.004);
   h3->Draw();

   TPolyLine3D *l1 = new TPolyLine3D(3);
   l1->SetPoint(0,2,1000,0.003);
   l1->SetPoint(1,2,4000,0. );
   l1->SetPoint(2,2,7000,-0.002 );
   l1->SetLineColor(kRed);
   l1->Draw();

   TPolyLine3D *l2 = new TPolyLine3D(3);
   l2->SetPoint(0,8,1000,0.004);
   l2->SetPoint(1,8,4000,0.001 );
   l2->SetPoint(2,8,7000,-0.001 );
   l2->SetLineColor(kGreen);
   l2->Draw();

   TPolyLine3D *l3 = new TPolyLine3D(3);
   l3->SetPoint(0,12,1000,-0.003);
   l3->SetPoint(1,12,4000,-0.001 );
   l3->SetPoint(2,12,7000, 0.002 );
   l3->SetLineColor(kBlue);
   l3->Draw();

   c1->Update();
}No, the drawing options are now available via the Editors.
Thanks, I’d missed this point so far…
3 remarks about your solution :
Using TPolyLine3D is a bit limiting since they do not care about the boundaries of the histogram.
Of course, this can be handled with if statements in the code (see the red curve).
But if one’s zooming with the mouse, it’s over.
Would there be a trick not to plot them outside a given volume?
Otherwise, TGraphs would be better… If so, how about implementing such a feature in Root?
Basic arguments of the TH3::Draw() method like “FB”, “BB”, “A” are not taken into account either in interpreted or compiled mode.
From the UG, they should be… Any clue?
Is it possible to reverse an axis in order that its origin be on the other extremity?
I’d like zmin (-0.004) and ymin (1000) to be superimposed (like in gnuplot).
Thanks in advance,
Z
Hi Olivier,
I wrote the following post on Friday. Maybe you missed it.
Could you please bring an answer to the following questions ?
Thanks in advance,
Z
Oups ! Of course one has to read “previous” instead of “following”…
I need sleep…
I was on holidays. I am back now.
The solution I gave you is of course not perfect as the option you are requesting is not implemented for TGraph or TGraph2D. Some work is needed to go further. TPolyLine3D is a low level graphics primitive and cannot do what higher level objects, like TGraph, do.
I guess the best way to have a clean implementation of this option would be to implement it in TMultiGraph (just a thought). If you are willing to do it you are welcome.
Unfortunately, I’m not skilled enough for the time being.
If someone wants to give it try, please do! ![]()
OK, here’s a way to get something similar to the above Gnuplot graph.
The trick lies in the use of a TH2 with a smart binning allowing the histogram to be interactively zoomed.
Of course polylines will escape the boundaries but once the view’s fine, this could easily be fixed with if statements.
Thanks Olivier 
#include <TPolyLine3D.h>
#include <TH2F.h>
#include <TCanvas.h>
#include <TLegend.h>

void mytest ( Double_t zmin=-10., Double_t zmax=+10. )
{
  Int_t nPoints=5 ;
  Double_t x1[] = {1., 3., 5., 7., 9.} ; Double_t x2[] = {1., 3., 5., 7., 9.} ;
  Double_t y1[] = {0., 0., 0., 0., 0.} ; Double_t y2[] = {3., 3., 3., 3., 3.} ;
  Double_t z1[] = {0., 3.,-2., 3., 4.} ; Double_t z2[] = {3.,-1., 2., 2., 0.} ;

  TPolyLine3D *line3D_1 = new TPolyLine3D (nPoints,x1,y1,z1) ; line3D_1->SetLineColor(kRed ) ;
  TPolyLine3D *line3D_2 = new TPolyLine3D (nPoints,x2,y2,z2) ; line3D_2->SetLineColor(kBlue) ;

  Double_t xmin=0., xmax=10., resolution=0.5 ; Int_t nBins = Int_t((xmax-xmin)/resolution) ;
  /// The binning should be adjusted to the interactive zoom resolution desired

  TH2F* histo = new TH2F("histo","", nBins,xmin,xmax, 1,y1[0],y2[0]) ;
    histo->SetStats(kFALSE) ;
    histo->SetMinimum(zmin) ; histo->SetMaximum(zmax) ;
    histo->SetXTitle("#lambda  [nm]"    ) ; histo->GetXaxis()->CenterTitle() ;
    histo->SetYTitle("time  [min]"      ) ; histo->GetYaxis()->CenterTitle() ;
    histo->SetZTitle("intensity  [a.u.]") ; histo->GetZaxis()->CenterTitle() ;

  TCanvas *canvas = new TCanvas("canvas","canvas",0,0,1000,618) ;
  canvas->SetTheta(23.) ; canvas->SetPhi(-23.) ;
  gPad->SetLeftMargin(0.18) ; gPad->SetRightMargin(0.10) ; gPad->SetTopMargin(0.20) ; gPad->SetBottomMargin(0.20) ;
    histo->Draw("lego0,fb") ; line3D_1->Draw() ; line3D_2->Draw() ;
    TLegend *leg = new TLegend(0.81,0.86,0.99,0.94) ; leg->SetTextSize(0.04) ; leg->SetBorderSize(0.) ;
    leg->AddEntry (line3D_1,"data 1","L") ; leg->AddEntry (line3D_2,"data 2","L") ;
    leg->Draw() ;
  //canvas->SaveAs("test.png") ;

  return ;
}Yeah I was looking for this too.
Why not use TGraph2D ?
Rene
This way of representing several graphs in parallel in 3D does not exist in TGraph2D. You can draw a Graph2D as points and if the points are close enough it will look similar but there is not way to plot them as lines and also change the color of each line.
Olivier,
The best solution would be to support a 3D option in TMultiGraph supporting all the 2D options of TGraph, but in 3D
Rene
I agree. That was what was requested initially. May be starting from the the example I provided would make it easy enough to implement.