TGraph filled in png but NOT filled in pdf

Hi,

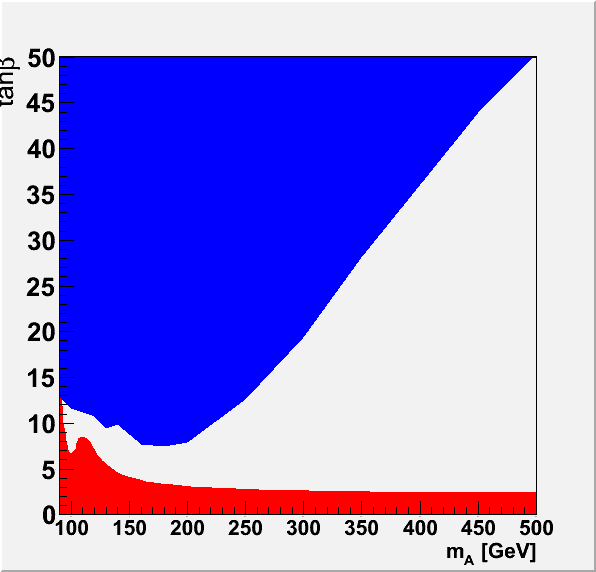
I’m writing TCanvases with filled TGraphs into png or pdf using TGraph::Write(). But while I get the filled TGraphs in the png the pdf just does not show the filling. The simplest example I tied looks like this (*). I’m using Root 5.27.06

Is this a known feature or am I doing something wrong :frowning:
Thanx for any help.
Roger

()
// draw a frame to define the range
TH1F
hr = canv.DrawFrame(outerBand->GetX()[0]-.1, min_, outerBand->GetX()[outerBand->GetN()-1]+.1, max_);
hr->SetXTitle(xaxis_.c_str());
hr->GetXaxis()->SetLabelFont(62);
hr->GetXaxis()->SetTitleFont(62);
hr->GetXaxis()->SetTitleColor(1);
hr->GetXaxis()->SetTitleOffset(1.05);
hr->SetYTitle(yaxis_.c_str());
hr->GetYaxis()->SetLabelFont(62);
hr->GetYaxis()->SetTitleSize(0.05);
hr->GetYaxis()->SetTitleOffset(1.12);
hr->GetYaxis()->SetLabelSize(0.05);
if(log_){ canv.SetLogy(1); }

// create LEP exclusion plot
TGraph * LEP = new TGraph();
LEP->SetPoint( 0, 80 , 0. );
LEP->SetPoint( 1, 91 , 100. );
LEP->SetPoint( 2, 91.8 , 30.02624);
LEP->SetPoint( 3, 91.845 , 22.07032);
LEP->SetPoint( 4, 91.845 , 17.12491);
LEP->SetPoint( 5, 91.84523, 13.64727);
LEP->SetPoint( 6, 92.61388, 11.94143);
LEP->SetPoint( 7, 93.38253, 10.03852);
LEP->SetPoint( 8, 94.91982, 9.021481);
LEP->SetPoint( 9, 95.68846, 8.107481);
LEP->SetPoint(10, 97.22578, 7.141608);
LEP->SetPoint(11, 99.5317 , 6.680381);
LEP->SetPoint(12, 103.375 , 7.189448);
LEP->SetPoint(13, 104.1436, 7.841313);
LEP->SetPoint(14, 106.4496, 8.326916);
LEP->SetPoint(15, 109.5242, 8.609568);
LEP->SetPoint(16, 112.5988, 8.438845);
LEP->SetPoint(17, 115.6733, 8.107481);
LEP->SetPoint(18, 118.748 , 7.384029);
LEP->SetPoint(19, 122.5912, 6.547911);
LEP->SetPoint(20, 126.4344, 5.963618);
LEP->SetPoint(21, 131.815 , 5.359424);
LEP->SetPoint(22, 138.7328, 4.752558);
LEP->SetPoint(23, 144.1134, 4.445624);
LEP->SetPoint(24, 149.4939, 4.186368);
LEP->SetPoint(25, 156.4118, 3.968637);
LEP->SetPoint(26, 164.8669, 3.687628);
LEP->SetPoint(27, 177.1653, 3.472575);
LEP->SetPoint(28, 187.9264, 3.29197 );
LEP->SetPoint(29, 203.2994, 3.141663);
LEP->SetPoint(30, 221.7469, 2.978266);
LEP->SetPoint(31, 241.7318, 2.861322);
LEP->SetPoint(32, 261.7167, 2.767383);
LEP->SetPoint(33, 283.2388, 2.676528);
LEP->SetPoint(34, 304.761 , 2.641027);
LEP->SetPoint(35, 334.7383, 2.554322);
LEP->SetPoint(36, 357.0292, 2.50367 );
LEP->SetPoint(37, 383.9319, 2.48701 );
LEP->SetPoint(38, 420.8271, 2.454023);
LEP->SetPoint(39, 452.3417, 2.421473);
LEP->SetPoint(40, 487.6996, 2.405361);
LEP->SetPoint(41, 550 , 2.405361);
LEP->SetPoint(42, 600 , 0. );

LEP->SetFillStyle(1);
LEP->SetFillColor(2.);
LEP->SetLineColor(2.);
LEP->Draw(“F”);

canv.RedrawAxis();

canv.Print(std::string(output_).append("").append(outputLabel).append(".png").c_str());
canv.Print(std::string(output_).append("").append(outputLabel).append(".pdf").c_str());
cmb_mssm.pdf (13.8 KB)


see the warning at the end of:

root.cern.ch/drupal/content/how- … -interface

Hi,

thanx for the quick answer. But I think that this is not a gv problem. I don’t even inspect the file using gv. Or is antialias also an issue for display an acroread?

Thanx a lot,
Roger

Ok I’ll check

Can you send an running example reproducing the problem ?

Hi,

yes – but i also proceeded my self already a bit. You can find a standalone example here (*). I realized now by doing the filling interactively that when using TGraph::SetFillStyle(1.) this will not result in a filled Graph in pdf while using TGraph::SetFillStyle(1001.) (which was the outcome of the interactive Dump on the TCanvas) does. Maybe this is already pretty much of a hint. Maybe I just did somethgin wrong and 1. is not expected to give filled areas?

Thanx for your help,
Roger

()
void test()
{
TCanvas
canv = new TCanvas(“test”, “test”, 600, 600);

/*
// draw a frame to define the range
TH1F* hr = canv.DrawFrame(90, 0, 500, 30);
hr->SetXTitle(“test-x”);
hr->GetXaxis()->SetLabelFont(62);
hr->GetXaxis()->SetTitleFont(62);
hr->GetXaxis()->SetTitleColor(1);
hr->GetXaxis()->SetTitleOffset(1.05);
hr->SetYTitle(“test-y”);
hr->GetYaxis()->SetLabelFont(62);
hr->GetYaxis()->SetTitleSize(0.05);
hr->GetYaxis()->SetTitleOffset(1.12);
hr->GetYaxis()->SetLabelSize(0.05);
*/

// create LEP exclusion plot
TGraph * LEP = new TGraph();
LEP->SetPoint( 0, 80 , 0. );
LEP->SetPoint( 1, 91 , 100. );
LEP->SetPoint( 2, 91.8 , 30.02624);
LEP->SetPoint( 3, 91.845 , 22.07032);
LEP->SetPoint( 4, 91.845 , 17.12491);
LEP->SetPoint( 5, 91.84523, 13.64727);
LEP->SetPoint( 6, 92.61388, 11.94143);
LEP->SetPoint( 7, 93.38253, 10.03852);
LEP->SetPoint( 8, 94.91982, 9.021481);
LEP->SetPoint( 9, 95.68846, 8.107481);
LEP->SetPoint(10, 97.22578, 7.141608);
LEP->SetPoint(11, 99.5317 , 6.680381);
LEP->SetPoint(12, 103.375 , 7.189448);
LEP->SetPoint(13, 104.1436, 7.841313);
LEP->SetPoint(14, 106.4496, 8.326916);
LEP->SetPoint(15, 109.5242, 8.609568);
LEP->SetPoint(16, 112.5988, 8.438845);
LEP->SetPoint(17, 115.6733, 8.107481);
LEP->SetPoint(18, 118.748 , 7.384029);
LEP->SetPoint(19, 122.5912, 6.547911);
LEP->SetPoint(20, 126.4344, 5.963618);
LEP->SetPoint(21, 131.815 , 5.359424);
LEP->SetPoint(22, 138.7328, 4.752558);
LEP->SetPoint(23, 144.1134, 4.445624);
LEP->SetPoint(24, 149.4939, 4.186368);
LEP->SetPoint(25, 156.4118, 3.968637);
LEP->SetPoint(26, 164.8669, 3.687628);
LEP->SetPoint(27, 177.1653, 3.472575);
LEP->SetPoint(28, 187.9264, 3.29197 );
LEP->SetPoint(29, 203.2994, 3.141663);
LEP->SetPoint(30, 221.7469, 2.978266);
LEP->SetPoint(31, 241.7318, 2.861322);
LEP->SetPoint(32, 261.7167, 2.767383);
LEP->SetPoint(33, 283.2388, 2.676528);
LEP->SetPoint(34, 304.761 , 2.641027);
LEP->SetPoint(35, 334.7383, 2.554322);
LEP->SetPoint(36, 357.0292, 2.50367 );
LEP->SetPoint(37, 383.9319, 2.48701 );
LEP->SetPoint(38, 420.8271, 2.454023);
LEP->SetPoint(39, 452.3417, 2.421473);
LEP->SetPoint(40, 487.6996, 2.405361);
LEP->SetPoint(41, 550 , 2.405361);
LEP->SetPoint(42, 600 , 0. );

LEP->SetFillStyle(1001.); // using 1. will not work – maybe my miss understanding
LEP->SetFillColor(2.);
LEP->SetLineColor(2.);
LEP->SetLineStyle(1.);
LEP->SetLineWidth(4.);
LEP->Draw(“AFL”);
canv->RedrawAxis();

canv->Print(“test.png”);
canv->Print(“test.pdf”);
}

yes it should be 1001