Hi,
I have this trvial python script to draw a simple TGraph (distilled from larger chunk of code):
points = [
(0, 2.836967833067155, 12399074.61),
(1, 6.954407211174568, 20542395.5),
(2, 11.970329210518978, 18499490.9),
(3, 19.424693860517632, 34068743.5),
(4, 29.43182028809318, 24889912.3),
(5, 39.414418675302066, 22688035.700000003),
(6, 49.38887514528897, 25505205.04),
(7, 59.363856464667286, 22036243.92),
(8, 69.3345592681046, 18366012.5),
(9, 79.3097616083224, 14811020.4),
(10, 89.28363506909325, 11568560.3),
(11, 103.50409212026426, 37625910.3),
(12, 119.21492822326776, 11485086.8),
(13, 133.24353243118534, 18563865.1),
(14, 153.08841322492458, 8265027.1),
(15, 172.95258012423116, 3801574.7),
(16, 195.74833705900488, 1737539.1),
(17, 227.38171871397918, 372180.6003 ),
(18, 269.56177047343357, 35339.70004 )]

import ROOT

gr = ROOT.TGraph(len(points))
for p, x, y in points:
  print(p,x,y)
  gr.SetPoint(p, x, y)
# OR
# gr.SetPointX(p, x)
# gr.SetPointY(p, y)

gr.Draw("AL*")
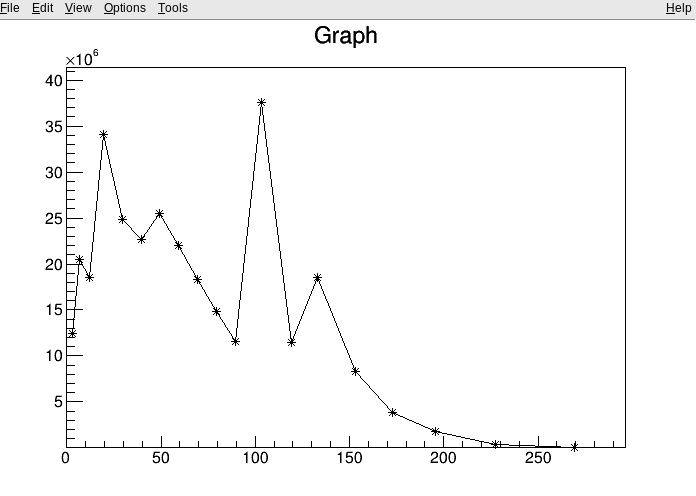
The graph is then drawn only when I click the canvas. But it comes out broken (see attached plot).
Point 14 has x and y positions screwed up. Why point 14?
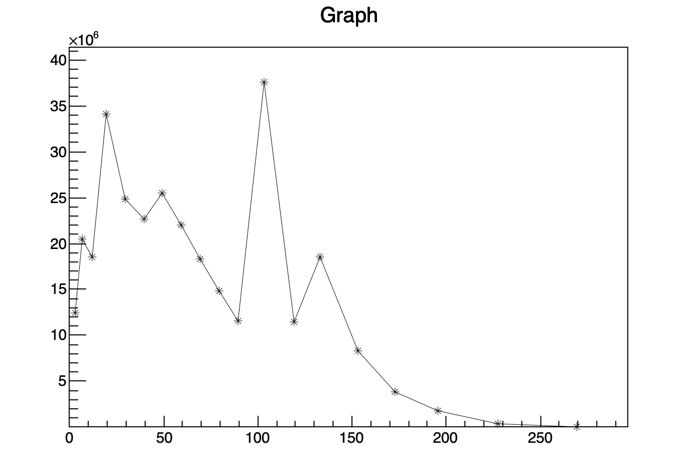
When I add ROOT.gPad.Update() at the end of the script the points come out as expected.
Seems like the “update” event is messing up sth.
ROOT Version: 6.24/02 , Python version: 3.9
Platform: MacOs BigSur
Compiler: Apple clang version 12.0.5 (clang-1205.0.22.11)