I see inconsistencies when the number of digits is large on the y-axis of TGraph objects (ROOT 6.11/02). I thought I had an idea about what was going on, but have just confused myself. In both C and python it seems that TGaxis::SetMaxDigits is ignored, but the results are different.
An example C script:
{
   const int numPoints = 250000;
   std::array<double, numPoints> x;
   std::array<double, numPoints> yA, yB;
   for (int i=0; i < numPoints; i++) {
      x.at(i) = i;
      yA.at(i) = gRandom->Gaus(1, 1E-4);
      yB.at(i) = gRandom->Gaus(8.23, 1E-5);
   }

   TGaxis::SetMaxDigits(1);

   TCanvas *c = new TCanvas("c","");
   c->Divide(1,2);
   c->cd(1);
   TGraph *g1 = new TGraph(numPoints, x.data(), yB.data());
   g1->Draw("ALP");
   c->cd(2);
   TGraph *g2 = new TGraph(numPoints, x.data(), yA.data());
   g2->Draw("ALP")
}
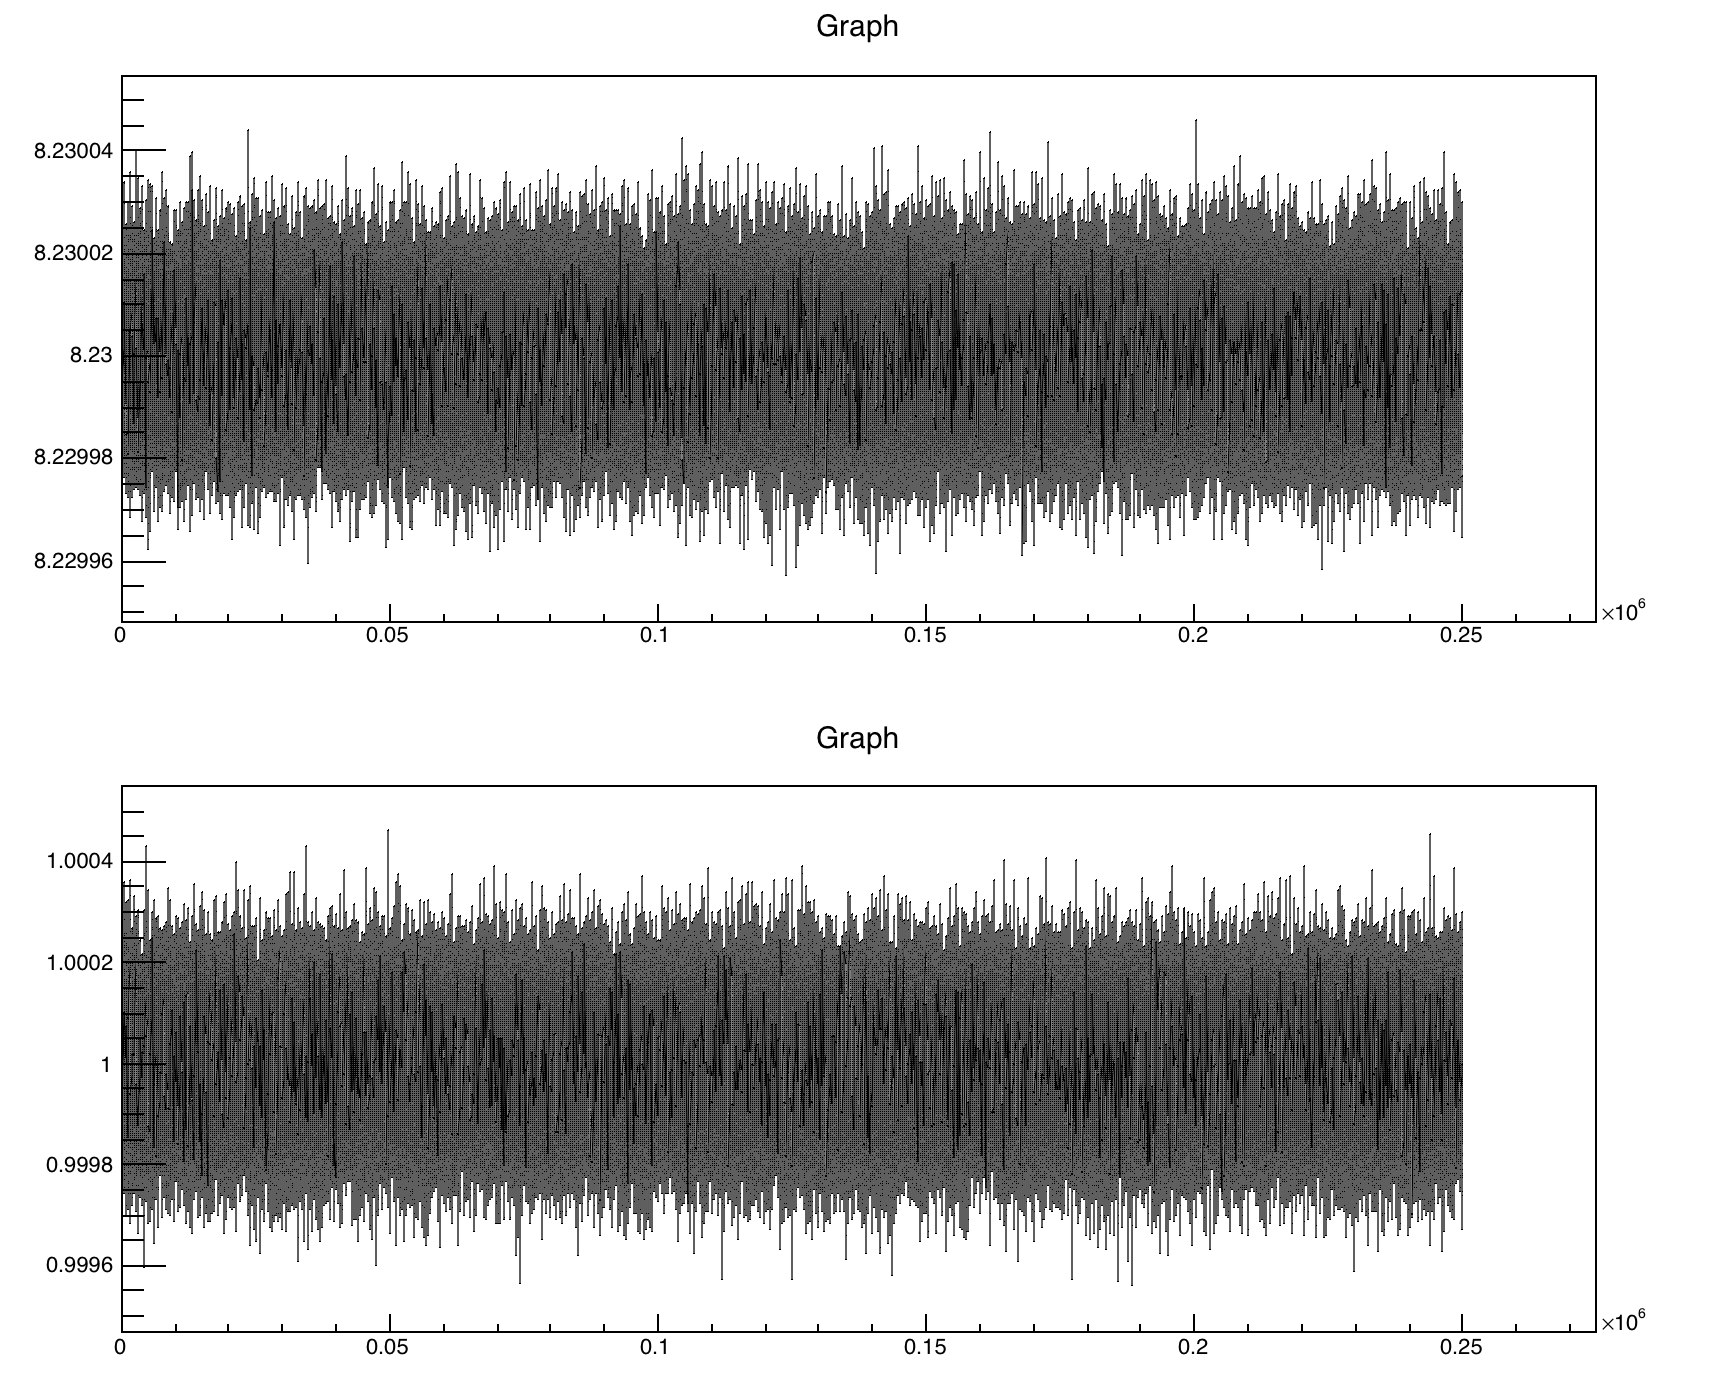
ROOT has placed all the necessary digits even though I requested max digits to be 1.
The digits are still visible here, but if I switch to one pad then they are truncated.
Finally, it we produce an equivalent python script:
import numpy as np
import ROOT

num_points = 250000
x = np.arange(num_points, dtype='float64')
y = 1E-10 * np.random.randn(num_points)
y2 = y + 8.23

ROOT.TGaxis.SetMaxDigits(1)

g = ROOT.TGraph(num_points, x, y)
g2 = ROOT.TGraph(num_points, x, y2)
c = ROOT.TCanvas("c")
c.Divide(1,2)
c.cd(1)
g.Draw("ALP")
c.cd(2)
g2.Draw("ALP")
c.Update()

raw_input("Press Enter to exit...")
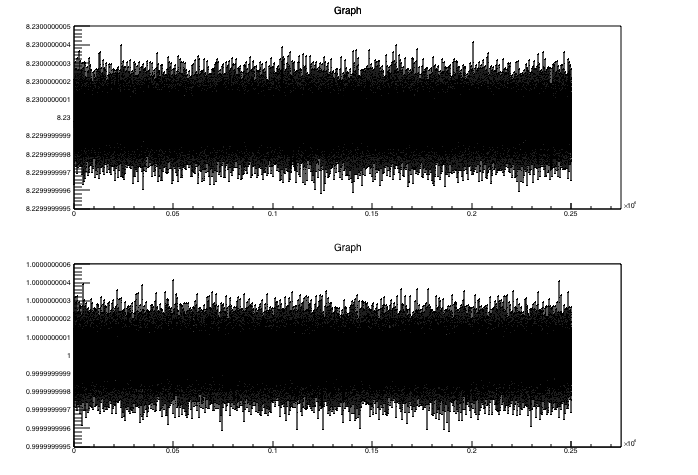
I end up with the following (python 2.7) which changes behavior based on the mean:
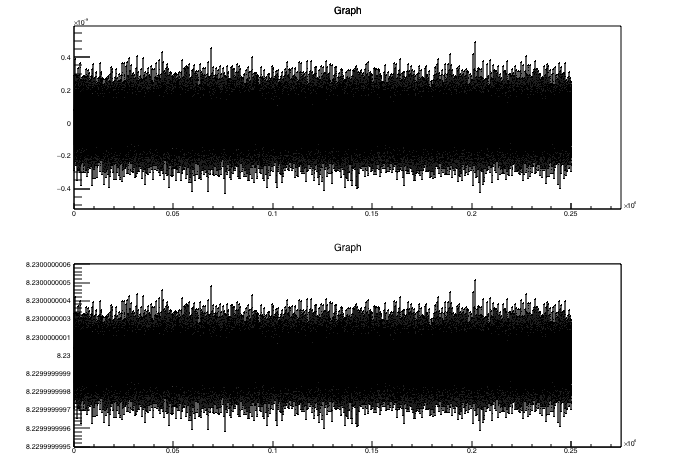
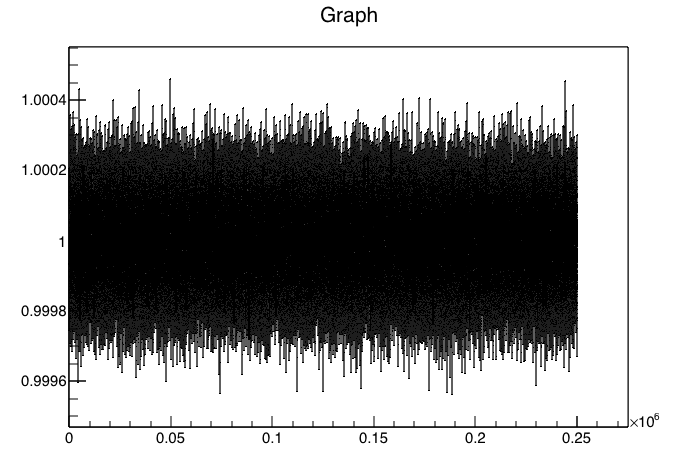
If I switch to a single pad in python I end up with this:

My biggest concern is the last figure. If the mean value has a large number of digits then the values written along the axis may be confused for a different number as it is not always clear they are truncated leaving only the least significant digits. (This is how I ended up investigating this). I’m not sure where to go from here to make the plot readable again.