I want to draw three histograms and a graph in one canvas. but I only got the third histogram and the graph. What should I do to get all the histograms?
It is not clear from your screen dump what are the graphs and the histogram. Moreover, you are mixing histogram drawing options and graph drawing options. Can you post your code as a text file and I will change it to make it work? As it is, it obviously doesn’t work.
Hi,
as couet already said try to post your code as a text file.
But if I should guess from what I see, try to remove the option "A" from the first, second and third histogram.
Stefano
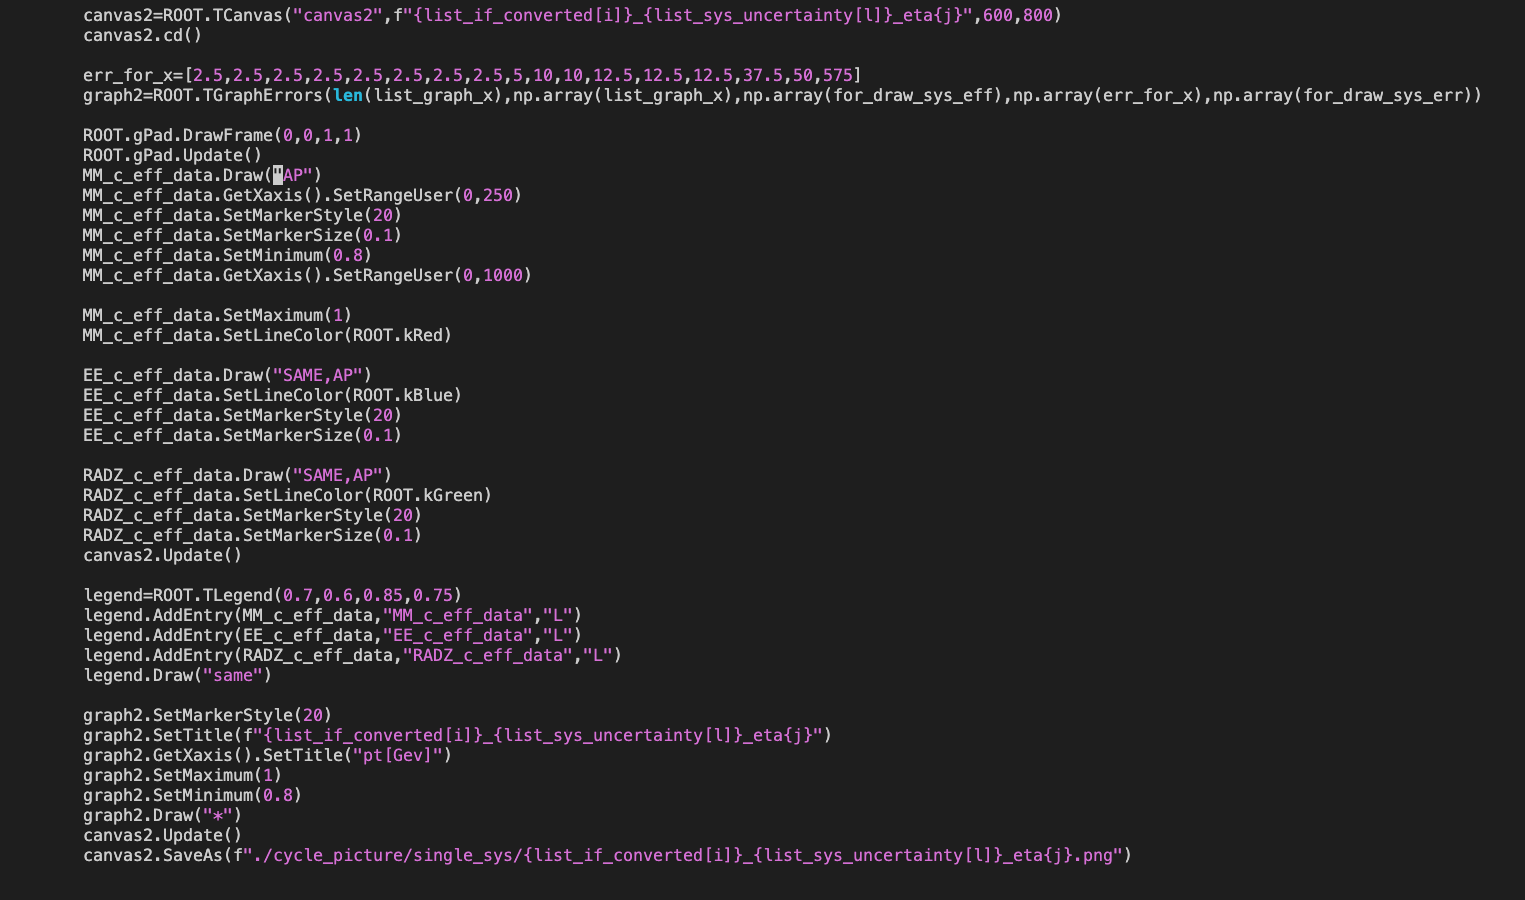
canvas2=ROOT.TCanvas("canvas2",f"{list_if_converted[i]}_{list_sys_uncertainty[l]}_eta{j}",600,800)
canvas2.cd()

err_for_x=[2.5,2.5,2.5,2.5,2.5,2.5,2.5,2.5,5,10,10,12.5,12.5,12.5,37.5,50,575]
graph2=ROOT.TGraphErrors(len(list_graph_x),np.array(list_graph_x),np.array(for_draw_sys_eff),np.array(err_for_x),np.array(for_draw_sys_err))

ROOT.gPad.DrawFrame(0,0,1,1)
ROOT.gPad.Update()

MM_c_eff_data.Draw("AP")

MM_c_eff_data.SetMarkerStyle(20)
MM_c_eff_data.SetMarkerSize(0.1)
MM_c_eff_data.SetMinimum(0.8)
MM_c_eff_data.GetXaxis().SetRangeUser(0,1000)


EE_c_eff_data.Draw("SAME,AP")
EE_c_eff_data.SetLineColor(ROOT.kBlue)
EE_c_eff_data.SetMarkerStyle(20)
EE_c_eff_data.SetMarkerSize(0.1)

RADZ_c_eff_data.Draw("SAME,AP")
RADZ_c_eff_data.SetLineColor(ROOT.kGreen)
RADZ_c_eff_data.SetMarkerStyle(20)
RADZ_c_eff_data.SetMarkerSize(0.1)
canvas.Update()

legend=ROOT.TLegend(0.7,0.6,0.85,0.75)
legend.AddEntry(MM_c_eff_data,"MM_c_eff_data","L")
legend.AddEntry(EE_c_eff_data,"EE_c_eff_data","L")
legend.AddEntry(RADZ_c_eff_data,"RADZ_c_eff_data","L")
legend.Draw("same")

graph2.SetMarkerStyle(20)
graph2.SetTitle(f"{list_if_converted[i]}_{list_sys_uncertainty[l]}_eta{j}")
graph2.GetXaxis().SetTitle("pt[Gev]")
graph2.SetMaximum(1)
graph2.SetMinimum(0.8)
graph2.Draw("*")
canvas.Update()
canvas2.SaveAs(f"./cycle_picture/single_sys/{list_if_converted[i]}_{list_sys_uncertainty[l]}_eta{j}.pdf")
MM,EE,RADZ are histograms. graph2 is graph.
canvas2=ROOT.TCanvas("canvas2",f"{list_if_converted[i]}_{list_sys_uncertainty[l]}_eta{j}",600,800)

err_for_x=[2.5,2.5,2.5,2.5,2.5,2.5,2.5,2.5,5,10,10,12.5,12.5,12.5,37.5,50,575]
graph2=ROOT.TGraphErrors(len(list_graph_x),np.array(list_graph_x),np.array(for_draw_sys_eff),np.array(err_for_x),np.array(for_draw_sys_err))

MM_c_eff_data.Draw("P")

MM_c_eff_data.SetMarkerStyle(20)
MM_c_eff_data.SetMarkerSize(0.1)
MM_c_eff_data.SetMinimum(0.8)
MM_c_eff_data.GetXaxis().SetRangeUser(0,1000)

EE_c_eff_data.Draw("SAME")
EE_c_eff_data.SetLineColor(ROOT.kBlue)
EE_c_eff_data.SetMarkerStyle(20)
EE_c_eff_data.SetMarkerSize(0.1)

RADZ_c_eff_data.Draw("SAME")
RADZ_c_eff_data.SetLineColor(ROOT.kGreen)
RADZ_c_eff_data.SetMarkerStyle(20)
RADZ_c_eff_data.SetMarkerSize(0.1)

legend=ROOT.TLegend(0.7,0.6,0.85,0.75)
legend.AddEntry(MM_c_eff_data,"MM_c_eff_data","L")
legend.AddEntry(EE_c_eff_data,"EE_c_eff_data","L")
legend.AddEntry(RADZ_c_eff_data,"RADZ_c_eff_data","L")
legend.Draw()

graph2.SetMarkerStyle(20)
graph2.SetTitle(f"{list_if_converted[i]}_{list_sys_uncertainty[l]}_eta{j}")
graph2.GetXaxis().SetTitle("pt[Gev]")
graph2.SetMaximum(1)
graph2.SetMinimum(0.8)
graph2.Draw("*")

canvas2.SaveAs(f"./cycle_picture/single_sys/{list_if_converted[i]}_{list_sys_uncertainty[l]}_eta{j}.pdf")
I have tried it . I got an empty picture.But if I add “A” to first histograms , I will get all the pictures.
From tutorial, I find for histogram,“A” stands for no axis. for graph,“A” stands for drawing axis. I want to know the reason.why they are contradictory?
It means MM_c_eff_data is a TGraph, not a histogram.
Option “A” for histograms means: do not draw the axis but still, the user space is redefined. If you want to not redefine the user space and use the space currently displayed the option to be used is “SAME”.
For TGraph the option “A” means redefining the user space and drawing the axis. By default, the TGraph is drawn in the current space on the screen like any other primitive (TLine, TBox, TArrrow, etc …). But TGraph is a bit special because it often holds user data and an option defining the user space according to the data stored in the TGraph was needed. That option is “A”.
OK,thank you very much!