I am trying to use TGraph in order to make exclusion plot…
But the behaviour is completely different than the one shown in the example of the TGraphPainter root.cern.ch/root/html/TGraphPainter.html
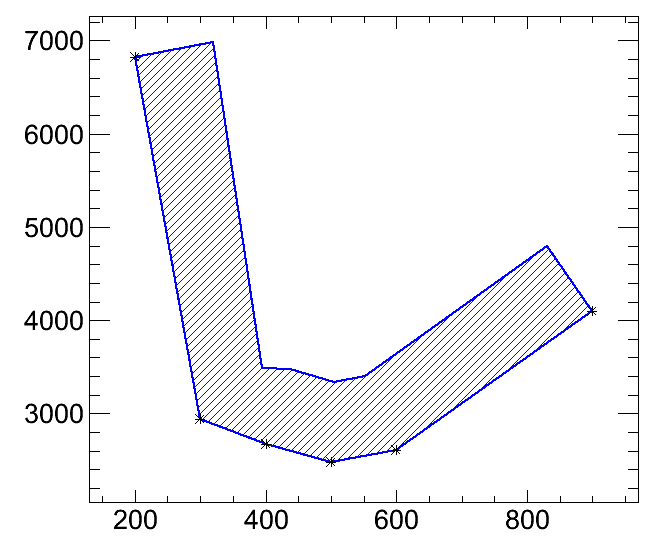
There is a line drawn all over the Filled area…, I obviously want the line only on the exclusion line and not on the complete area circonference. What can I do to have things drawn as in the example?
See my attachement…
Here is the code snippet I use:
TCanvas* c1;
c1 = new TCanvas(“c1”, “c1”,800,600);
TGraph* GluinoExclusion = new TGraph(6,Mass,XSec);
GluinoExclusion->SetLineColor(4);
GluinoExclusion->SetFillColor(4);
GluinoExclusion->SetLineWidth(2002);
GluinoExclusion->SetFillStyle(3004);
GluinoExclusion->Draw(“AL* same”);
SaveCanvas(c1, “”, “GluinoExclusion”);
delete c1;
Could you provide the shortest possible running script reproducing your problem?
You seem to define a TGraph with at least 12 points and not 6 as you show in your code snippet!
No, there is only 6 points, see the markers on the graph…
But trying to minimalize the macro that reproduce the bug, I unerstood that the problem is only present when “-b” argument is used.
Try the following:
root TGraphDebug.C++ -l -b -q
and check the produced picture ( _GluinoExclusion.png )
it will look similar to the one I posted yesterday…
Now do the same, but without “-b” argument:
root TGraphDebug.C++ -l -q
the picture looks as expected…
I think it is a bug,
I would appreciate if you can give me an easy fix, because I need to produce hundreds of plots and “-b” argument is really necessary in that case.
This problem was visible only with binary images generated in batch mode. It was visible in stressGraphics for instance. I have fixed it recently. So it is working properly in the last ROOT version.
In TImageDump the hollow filled areas were not correct:
they used the line attributes,
a line was drawn around the polygons filled with patterns.
This fixes the problem mentionned here: savannah.cern.ch/bugs/index.php?59263 as well as the test #22 in stressGraphics (no need to change the reference file).