Dear ROOT experts,
I am trying to add a second x-axis on a plot. My first axis is in sin2(theta) and the second one should be in theta. So I use the TGaxis constructor with a TF1.
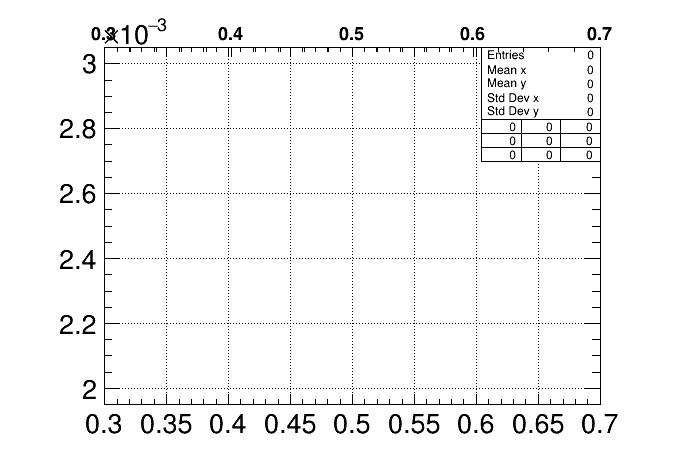
The code at the bottom of the post, inspired from the examples found there is generating the axis tick correctly, however the label are wrong. They should be from 33.2109 to 56.7891 but they are just identical to the ones of the first axis as you can see on the output plot attached
Any idea of what is wrong?
Here is the code:
#include "TH2D.h"
#include "TF1.h"
#include "TGaxis.h"
#include "TCanvas.h"

void test(){

  double ymin = 1.95e-3;
  double ymax = 3.05e-3;
  double xmin = 0.3;
  double xmax = 0.7;
  TH2F hxy("hxy1","",100,xmin,xmax,100,ymin,ymax);

  string xfunc = "TMath::ASin(TMath::Sqrt(x)) * TMath::RadToDeg()";

  TF1 *fxaxis2=new TF1("fxaxis2", xfunc.c_str(), xmin, xmax );
  cout<<xmin<<" "<<xmax<<" "<<fxaxis2->Eval(xmin)<<" "<<fxaxis2->Eval(xmax)<<endl;
  TGaxis *xaxis2 = new TGaxis(xmin,ymax,xmax,ymax, "fxaxis2", 505, "-");
  cout<<xmin<<" "<<xmax<<" "<<xaxis2->GetFunction()->Eval(xmin)<<" "<<xaxis2->GetFunction()->Eval(xmax)<<endl;

  TCanvas cv;
  hxy.Draw();
  xaxis2->Draw();

  cv.SaveAs("test.png");

}
Please read tips for efficient and successful posting and posting code
_ROOT Version: 6.20/04
Built for linuxx8664gcc on Apr 01 2020, 08:28:48
From tags/v6-20-04@v6-20-04
Platform: CENTOS7
Compiler: root -l test.C+