Hello,
I am trying to draw a line and a bunch of scattered data points in a single plot.
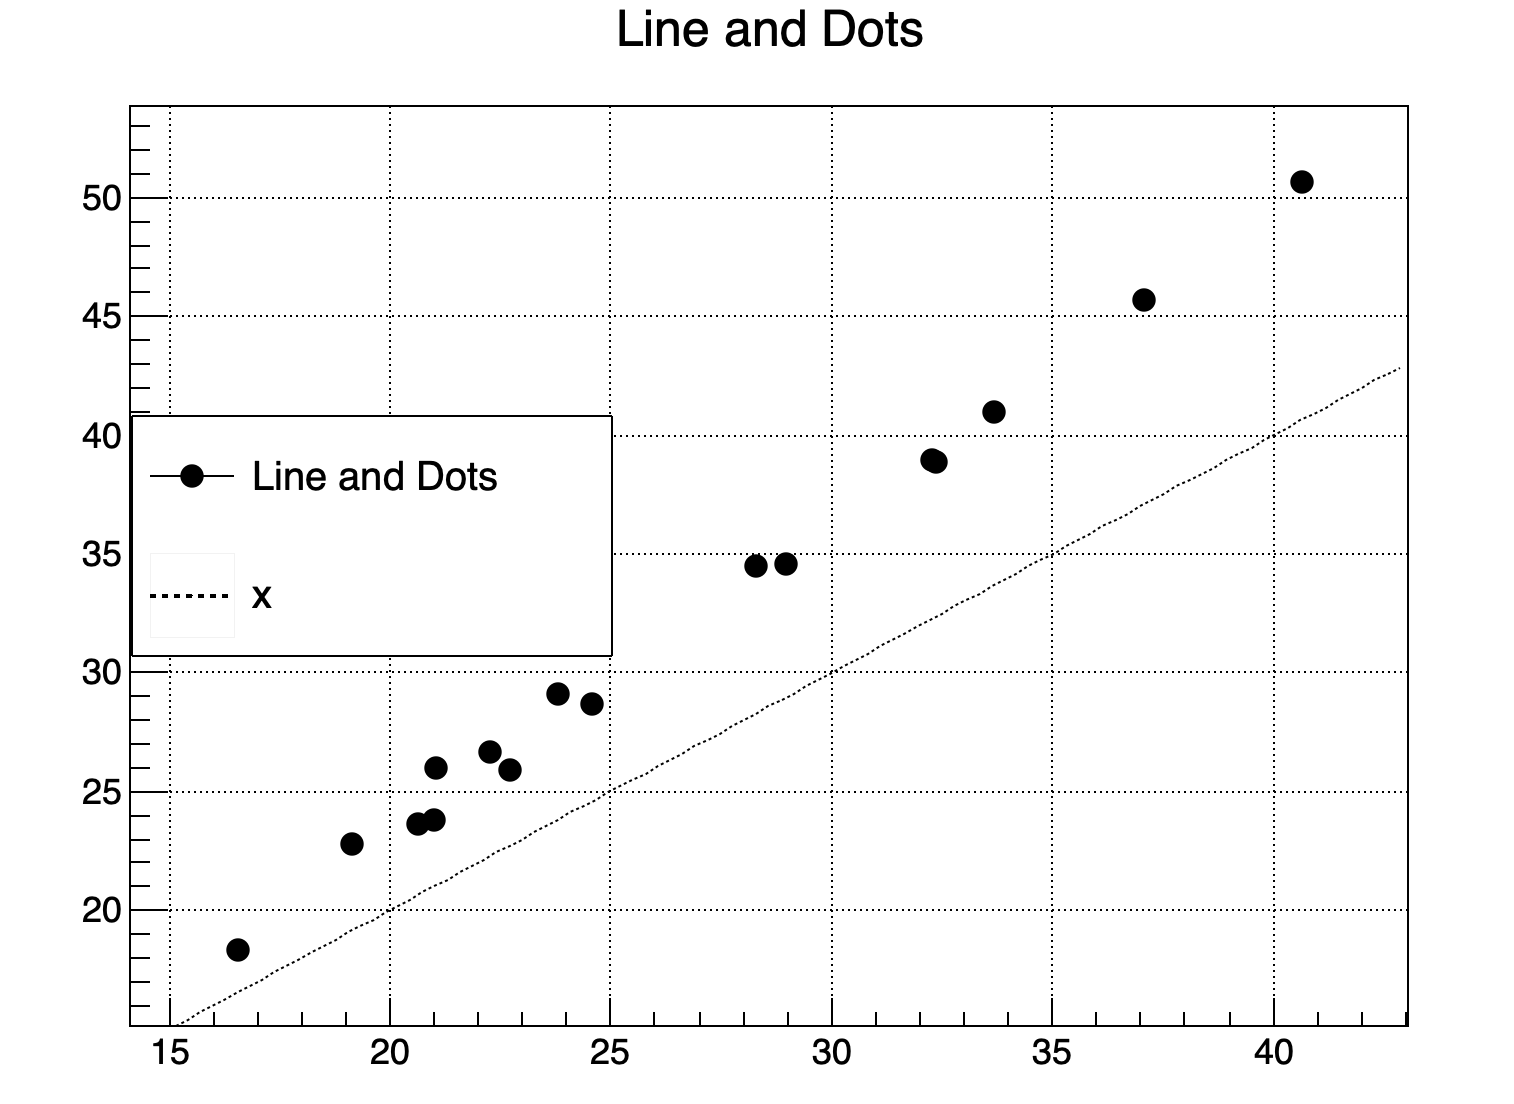
However, the line (TF1) is not displayed. It is shown only if I remove the TGraph.
A small reproducible example is shown here:
c_lines = ROOT.TCanvas("lines", "Line example", 800, 600)
c_lines.SetGrid()

df = pd.DataFrame(
{'x': [32.2543875 , 32.37384926, 37.06986562, 40.62741964, 23.80890625,
       33.69093333, 24.59484277, 28.29819286, 28.95675625, 19.12544219,
       20.65246745, 21.00576146, 21.02378906, 22.28737891, 22.73868256,
       16.53844494],
 'y': [38.96790937, 38.83277604, 45.6968875 , 50.63025   , 29.11910938,
       41.01595417, 28.65131055, 34.47265714, 34.612625  , 22.81224219,
       23.67295486, 23.79253367, 25.97751094, 26.68250391, 25.89570513,
       18.35850781]})

g = ROOT.TGraph(len(df.index), df['x'].values, df['y'].values)
g.SetMarkerSize(1.4)
g.SetMarkerStyle(20)
g.SetMarkerColor(1)
g.SetTitle('Line and Dots')
g.Draw('AP')

line = ROOT.TF1("Linear", "x")
line.SetLineColor(1)
line.SetLineStyle(2)
line.DrawClone('Same')


c_lines.BuildLegend()
c_lines.Draw()
Is there any trick to it?
It is possible that TF1 is not the right object, and maybe I should be using TLine. However, with TLine, I do not know how to set the length automatically across the existing TGraph.