Hi,
I have a question concerning the picture I attached below.
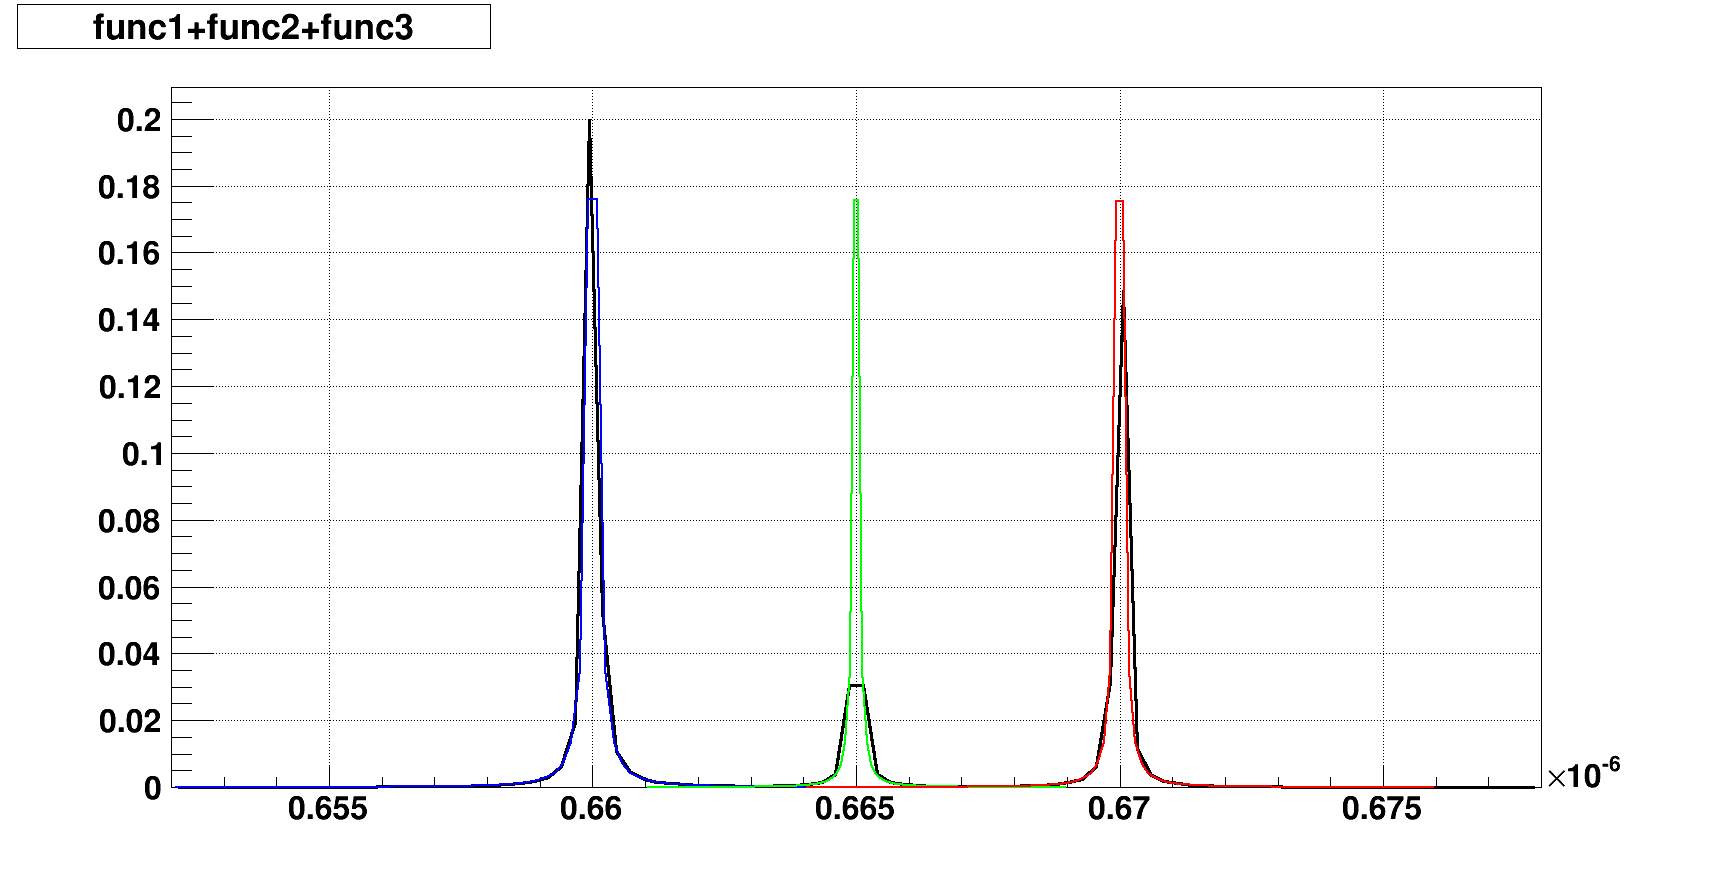
There are three Lorentz-curves modelled (blue, green and red) and displayed together with the additon of all of them (black).
[code]
TF1* f1 = new TF1(“func1”,"[0]/[1][2][3]exp(-[0]/([1][4]))[5]/(pow([5],2)+4pow(x-[1],2))",line1.wavelength-50line1.starkline1.EDens,line1.wavelength+ 50line1.starkline1.EDens);
f1->SetParameters(hc,line1.wavelength,line1.A,line1.g,kbline1.T,line1.starkline1.EDens);
TF1* f2 = new TF1("func2","[0]/[1]*[2]*[3]*exp(-[0]/([1]*[4]))*[5]/(pow([5],2)+4*pow(x-[1],2))",line2.wavelength-50*line2.stark*line2.EDens,line2.wavelength+ 50*line2.stark*line2.EDens);
f2->SetParameters(hc,line2.wavelength,line2.A,line2.g,kb*line2.T,line2.stark*line2.EDens);

TF1* f3 = new TF1("func3","[0]/[1]*[2]*[3]*exp(-[0]/([1]*[4]))*[5]/(pow([5],2)+4*pow(x-[1],2))",line3.wavelength-50*line3.stark*line3.EDens,line3.wavelength+ 50*line3.stark*line3.EDens);
f3->SetParameters(hc,line3.wavelength,line3.A,line3.g,kb*line3.T,line3.stark*line3.EDens);

TF1 * ft = new TF1("ftotal","func1+func2+func3",line1.wavelength-50*line1.stark*line1.EDens,line3.wavelength+50*line1.stark*line1.EDens);

f1->SetLineColor(kBlue);
f2->SetLineColor(kGreen);
f3->SetLineColor(kRed);
ft->SetLineColor(kBlack);
ft->SetLineWidth(3);
TCanvas* canvas = new TCanvas(“name”,“func”,750,580);
canvas->cd();
ft->Draw(“L”);
f1->Draw(“LSAME”);
f2->Draw(“LSAME”);
f3->Draw(“LSAME”);[/code]
If one looks at the picture, the curves are not really smooth and in some points the addition-function (TF1* ft) does not represent the addition of the functions f1, f2 and f3.
Does anybody know how to solve this problem?
Thanks!!
Chris