void makeplot() {
float r = 0.3;
float epsilon = 0.02;
// histograms preparations
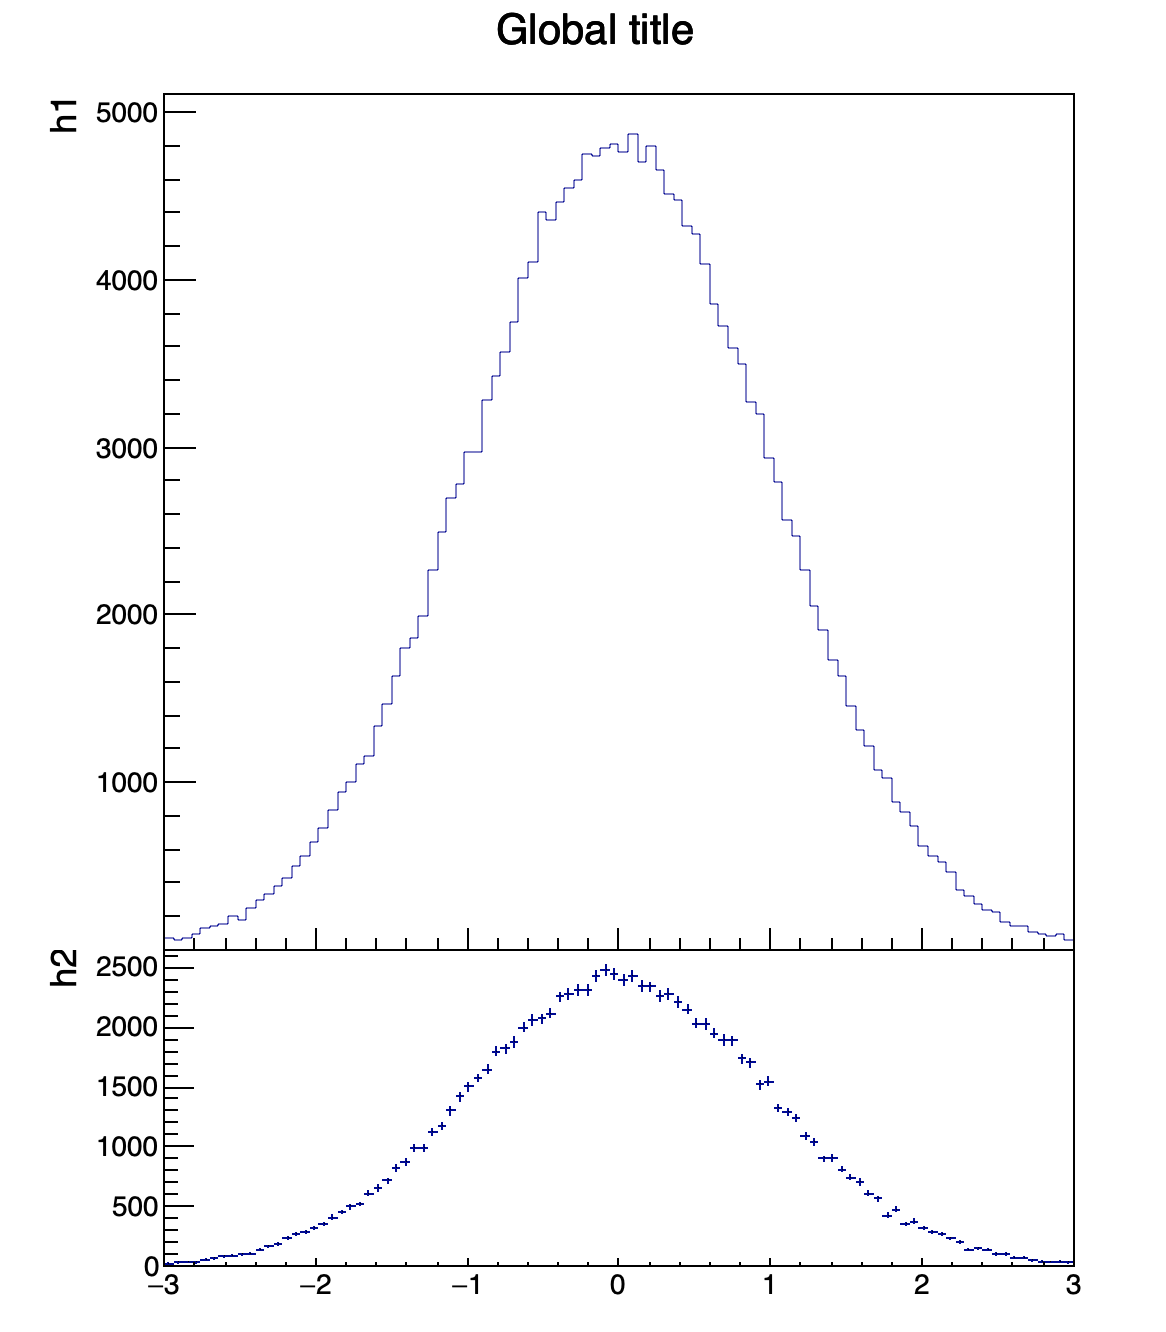
TH1F *h1 = new TH1F("h1", "test1", 100, -3, 3);
h1->SetStats(0);
h1->GetXaxis()->SetLabelSize(0.);
h1->GetXaxis()->SetTitleSize(0.);
h1->FillRandom("gaus", 200000);
h1->SetMinimum(0.);
TH1F *h2 = new TH1F("h2", "test2", 100 , -3, 3);
h2->SetStats(0);
h2->FillRandom("gaus", 100000);
// a canvas
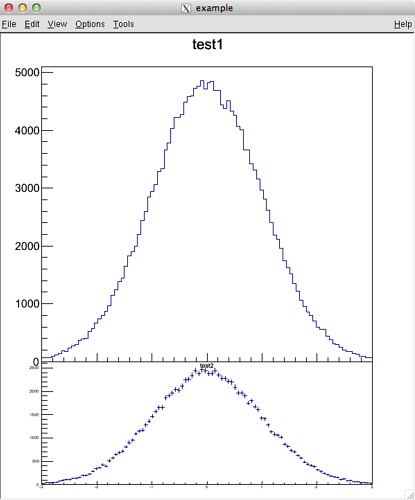
TCanvas *c1 = new TCanvas("c1", "example", 600, 700);
// pads
// use epsilon to make sure 0 is properly visualized, not truncated
TPad *pad1 = new TPad("pad1", "pad1", 0, r-epsilon, 1, 1);
pad1->SetBottomMargin(epsilon);
// upper y is not r - epsilon
TPad *pad2 = new TPad("pad2", "pad2", 0, 0, 1, r*(1-epsilon));
pad2->SetTopMargin(0);
pad2->SetFillColor(0);
pad2->SetFillStyle(0);
// leave enough spaces for title
pad1->SetLeftMargin(0.14);
pad2->SetLeftMargin(0.14);
pad2->SetBottomMargin(0.2);
// start to draw
c1->cd();
pad1->Draw();
pad1->cd();
h1->Draw();
c1->cd();
pad2->Draw();
pad2->cd();
h2->Draw("ep");
// you can stop here and comment the below.
// Check the output and compare with the one after manipulations below
// manipulate the histograms
h1->GetYaxis()->SetTitle("h1");
h2->GetYaxis()->SetTitle("h2");
// scale factor in y direction, pad1 / pad2
double scale_y = (1-r+epsilon)/r/(1-epsilon);
double scale_x = 1;
// these are easy to scale
h2->GetYaxis()->SetLabelSize(scale_x * scale_y * h1->GetYaxis()->GetLabelSize());
h2->GetYaxis()->SetTitleSize(scale_x * scale_y * h1->GetYaxis()->GetTitleSize());
h2->GetXaxis()->SetLabelSize(scale_x * scale_y * h2->GetXaxis()->GetLabelSize());
h2->GetXaxis()->SetTickLength(scale_y * h1->GetXaxis()->GetTickLength());
// title offset is hard to control.
// I have to set the offset manually,
// otherwise it hits the margin of the canvas.
// Can I have a way to set the offset using some functions/calculations?
// h2->GetYaxis()->SetTitleOffset(0.7);
// What TRatioPlot is are shown below.
// The titles are not aligned perfectly, but it is better than the above.
TCanvas *c2 = new TCanvas("c2", "ratio plot", 600, 700);
TH1D* hgaus = new TH1D("hgaus", "", 60, -3, 3);
hgaus->FillRandom("gaus");
hgaus->Fit("gaus");
TRatioPlot* rp = new TRatioPlot(hgaus);
rp->SetSeparationMargin(0);
c2->Draw();
rp->Draw();
rp->GetLowerRefYaxis()->SetTitle("ratio");
rp->GetUpperRefYaxis()->SetTitle("entries");
rp->GetLowerPad()->SetLeftMargin(0.14);
rp->GetUpperPad()->SetLeftMargin(0.14);
}
Would this snippet of example code help? I have a few comments in the macro and I hope they can explain my question.
As posted in the comment of the macro, how can I determine the title offset of the lower pad without by eye?
My naive answer is to make plot by pixel, which is not possible now. Can I request such a function in the future?
TRatioPlot is not perfect but still acceptable. Can we have a class provide the histogram frames of TRatioPlot without restricting the lower pad for ratio? And maybe this proposed class can provide more pads, rather than just upper and lower pads?
Many thanks in advance!