I’m having a problem with user-defined axis labels. I’d like the X-axis labels to rotate from a certain angle in order not to overlap onto each other. I used to have it work without the ratio plot (it was done automatically), but now that I’ve added this extra pad, they stay horizontal for some reason. Any idea why and how to get back to the default, rotating behaviour?
I’m uploading the macro (it’s in pyROOT actually) here:
I removed the PATH in your script but still it does not work.
Do you have a running version without doing too much editing ?
 % python3 makeSelectionEfficiency.py -m 100 -q 1
Filling file M100_Q1_analysisSample.root
Error in <TFile::TFile>: file /Users/couet/Downloads/M100_Q1_analysisSample.root does not exist
Traceback (most recent call last):
  File "makeSelectionEfficiency.py", line 341, in <module>
    fillEfficiency(h_noHack_passed,h_noHack_total,nBins,mass,charge,0)
  File "makeSelectionEfficiency.py", line 16, in fillEfficiency
    f = ROOT.TFile(fileName)
  File "/Users/couet/git/couet-root-bin/lib/ROOT/_pythonization/_tfile.py", line 90, in _TFileConstructor
    raise OSError('Failed to open file {}'.format(args[0]))
OSError: Failed to open file M100_Q1_analysisSample.root
That is weird. I tried it locally on my computer (python 3.8.10, ROOT 6.24/06) and it still doesn’t work. But I don’t expect this to be a version issue anyway since it used to work without the ratio plot.
Filling file M100_Q1_analysisSample.root
nEntries = 8087
Filling file M100_Q1_muonHack.root
nEntries = 7977
Filling file M100_Q1_elossDown.root
nEntries = 7977
Filling file M100_Q1_elossUp.root
nEntries = 7977
Scaling from the hack after L0 = 1.0166972226447741 -0.0005041034664337372 -0.0003372215904805568
Scaling from the hack after L1 = 1.0187046428657727 -0.0018042889746166452 0.002405718632822149
Scaling from the hack after L1 = 1.0180919636806016 -0.0018053747805538466 0.0024071663740720174
Scaling from the hack after L1 = 1.0180919636806016 -0.0018053747805538466 0.0024071663740720174
Scaling from the hack after L1 = 1.017174993799565 -0.0018080950215144194 0.0024107933620193147
Scaling from the hack after L1 = 1.0144156049208461 -0.002123522469922048 0.0027302431756141194
Scaling from the hack after L1 = 1.005038571051364 -0.0023501922523164556 0.0033574175033092434
Scaling from the hack after L1 = 1.002875572896106 -0.002045345652679255 0.0030680184790188823
Scaling from the hack after L1 = 1.0079357108649998 -0.002399314883133104 0.0034275926901899535
Scaling from the hack after L1 = 1.0082247168540106 -0.003113637901243888 0.004497476968463496
Scaling from the hack after L1 = 1.0145599046132 0.018266817065783956 -0.010231905764404033
Scaling from the hack after L1 = 0.9914592328596252 0.039764070096312186 0.045540328495463744
Scaling from the hack after HLT = 0.992282588975215 0.03797254252297754 0.04302127471719905
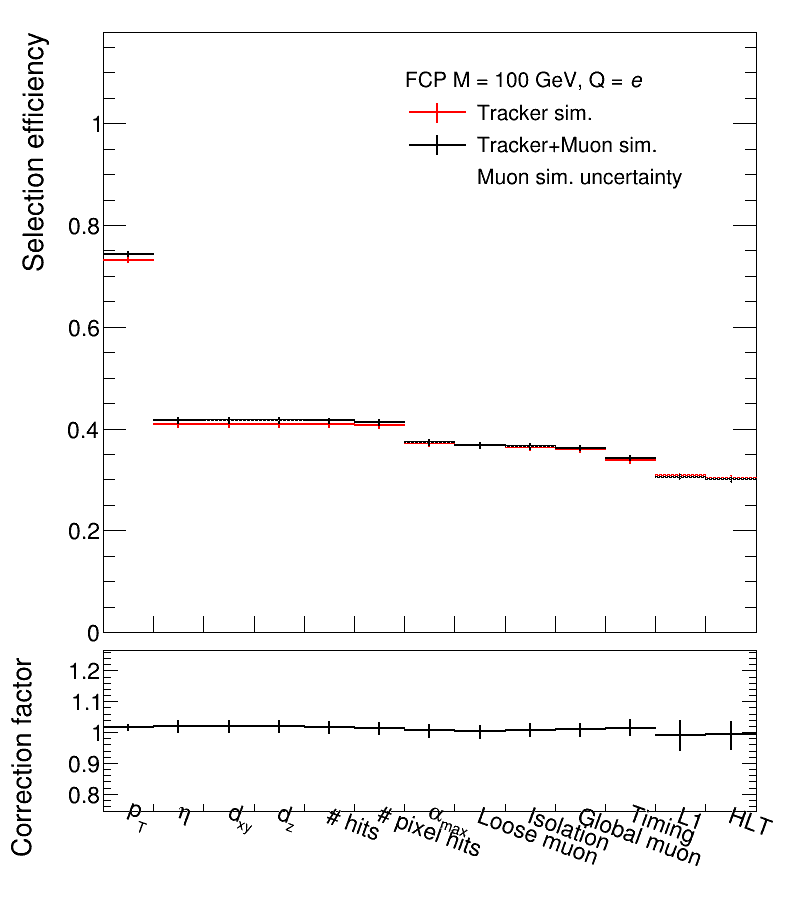
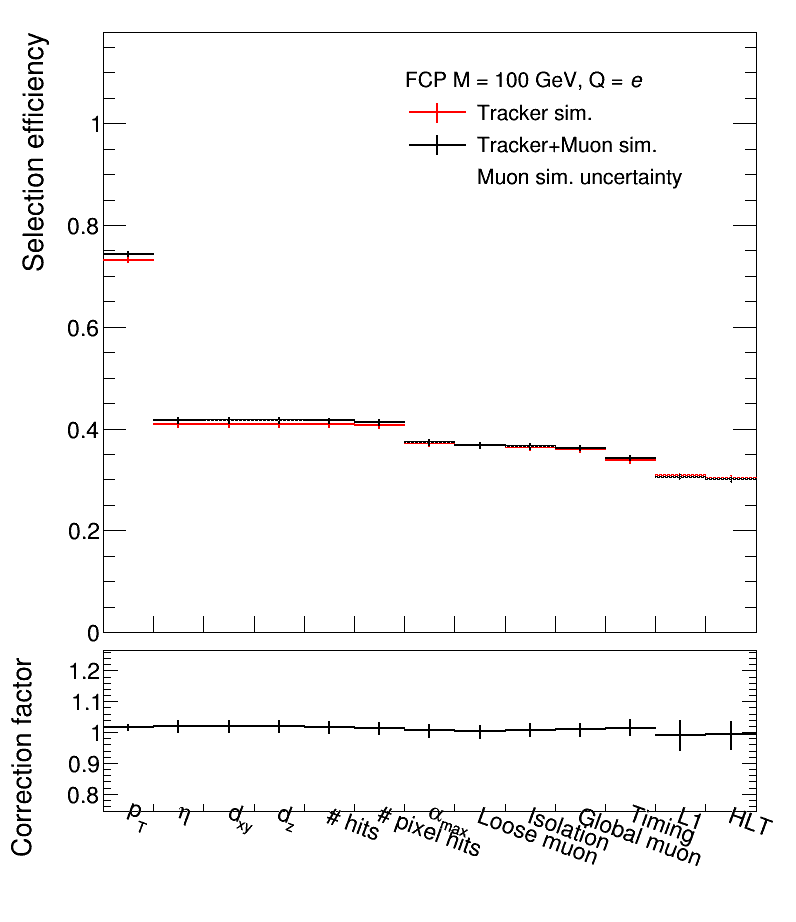
Info in <TCanvas::Print>: png file selectionEfficiency_M100_Q1.png has been created
Info in <TCanvas::Print>: pdf file selectionEfficiency_M100_Q1.pdf has been created
Ok then I don’t get how you’re just getting something different. What version of ROOT/python are you using? Also I don’t see the x-axis title on your version of the plot… Maybe in your version the offset is too large.
So I upgraded to ROOT 6.26 (I was on ROOT 6.24) and I now get the same plot as you. So there is something in 6.24 that is such that with a single plot the labels rotate but not anymore with a ratio plot, and this seems to be fixed with 6.26. That’s how I understand this.