Hello ROOT forum,
I need to make a tool to browse text graphs. I have used ROOT for a long time for simple histograms and scatterplots, but I’ve never used any of the advanced display functions.
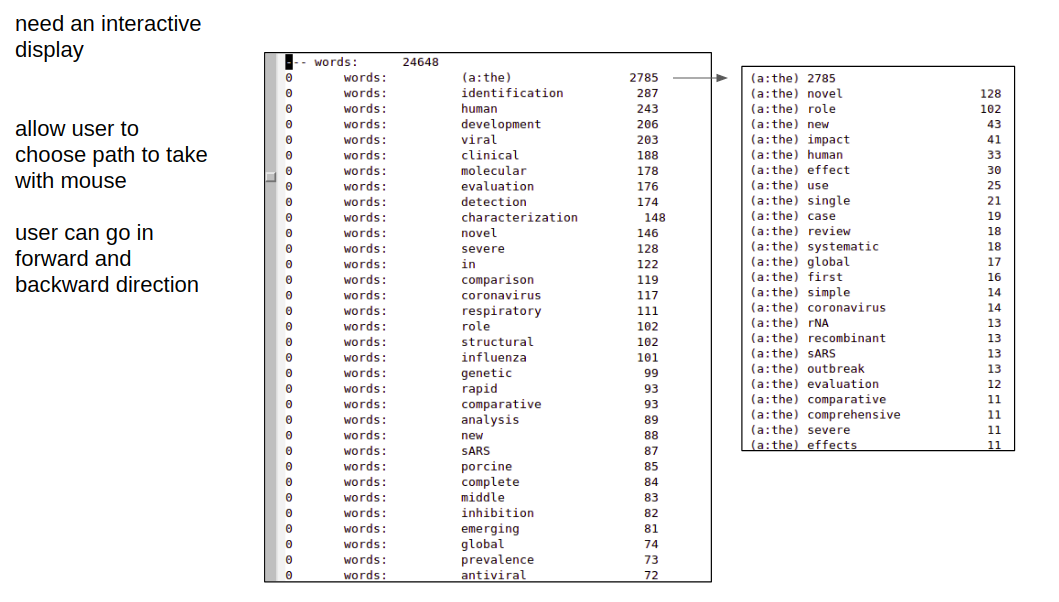
This is part of a data challenge related to the virus. There have been ~45K journal articles written about it to date, and the NLP and text mining communities have the articles aggregated together for analysis.
I have an unpublished analysis of the Wordnet dictionary that I dusted off and ran the new text corpus through: https://drive.google.com/open?id=1C_hrj_pN44aMBIr1ilaTGXALUK_D8SxamBnpKsAisp4
Working through the text graphs in the analysis, it seems one possible use might be to make a tool that would allow an expert user to browse the text graphs more easily, as depicted in the image (page 10 of deck).
If anyone has any ideas for how to implement such an interactive browser in ROOT, please let me know.
thanks
Ken