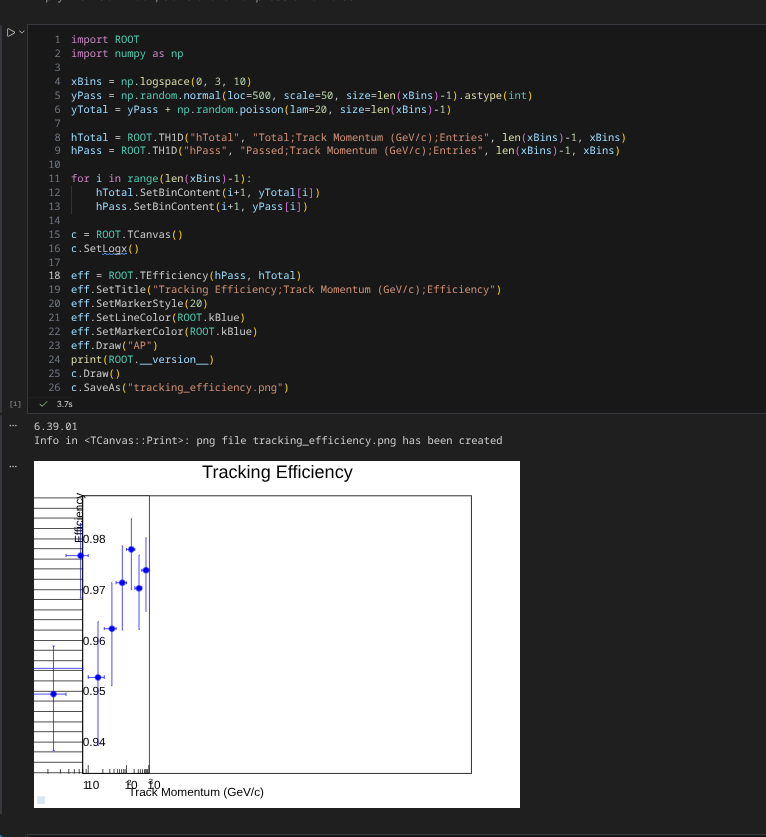
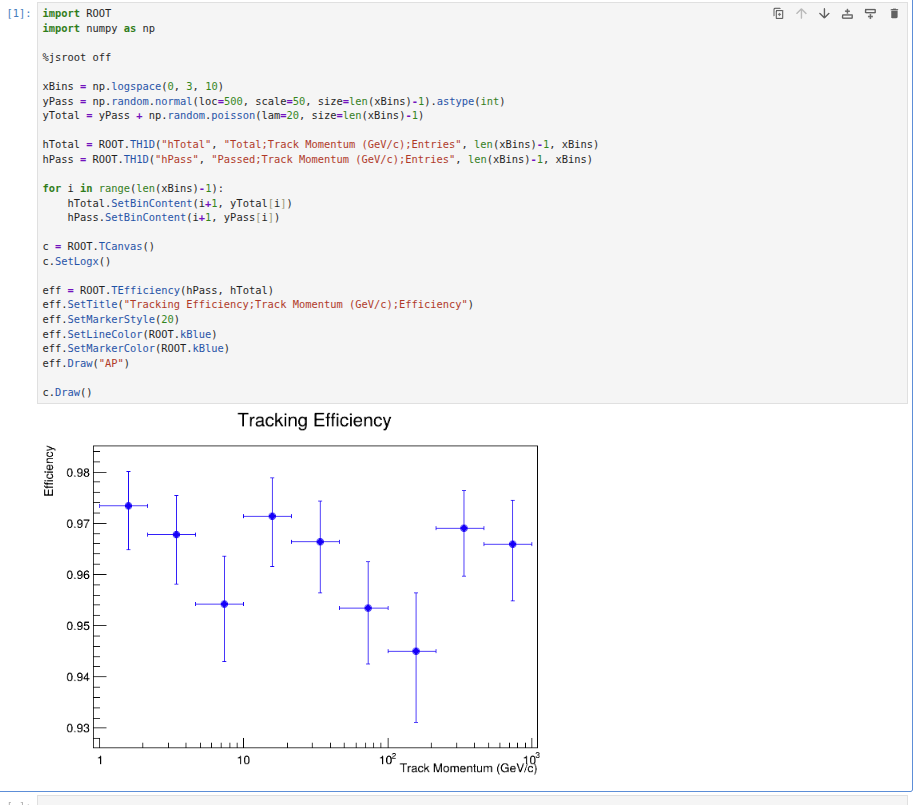
Just wanted to check how the TEfficiency class are supposed to be drawn on a log Canvas. I am hoping I’ve done something stupid here. Here is a quick reproducer.
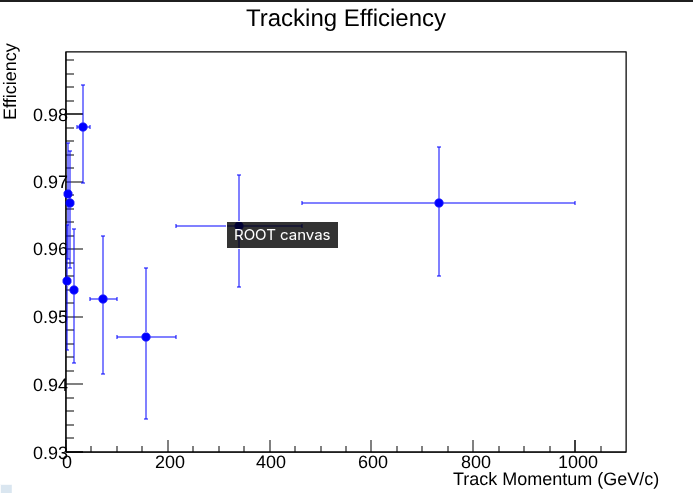
Without the logScale it works perfectly.
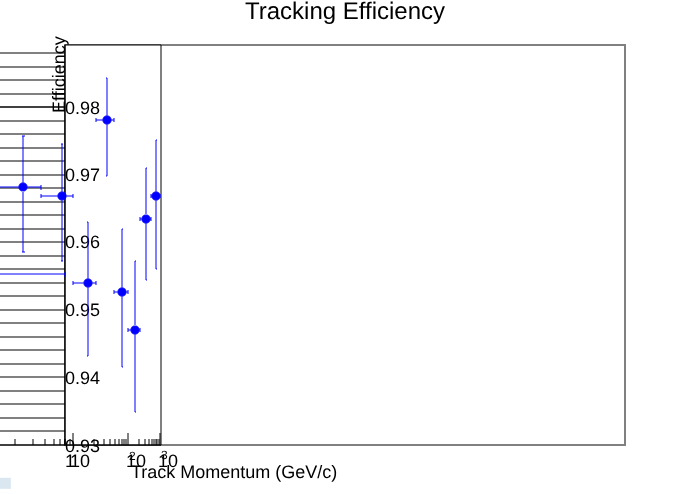
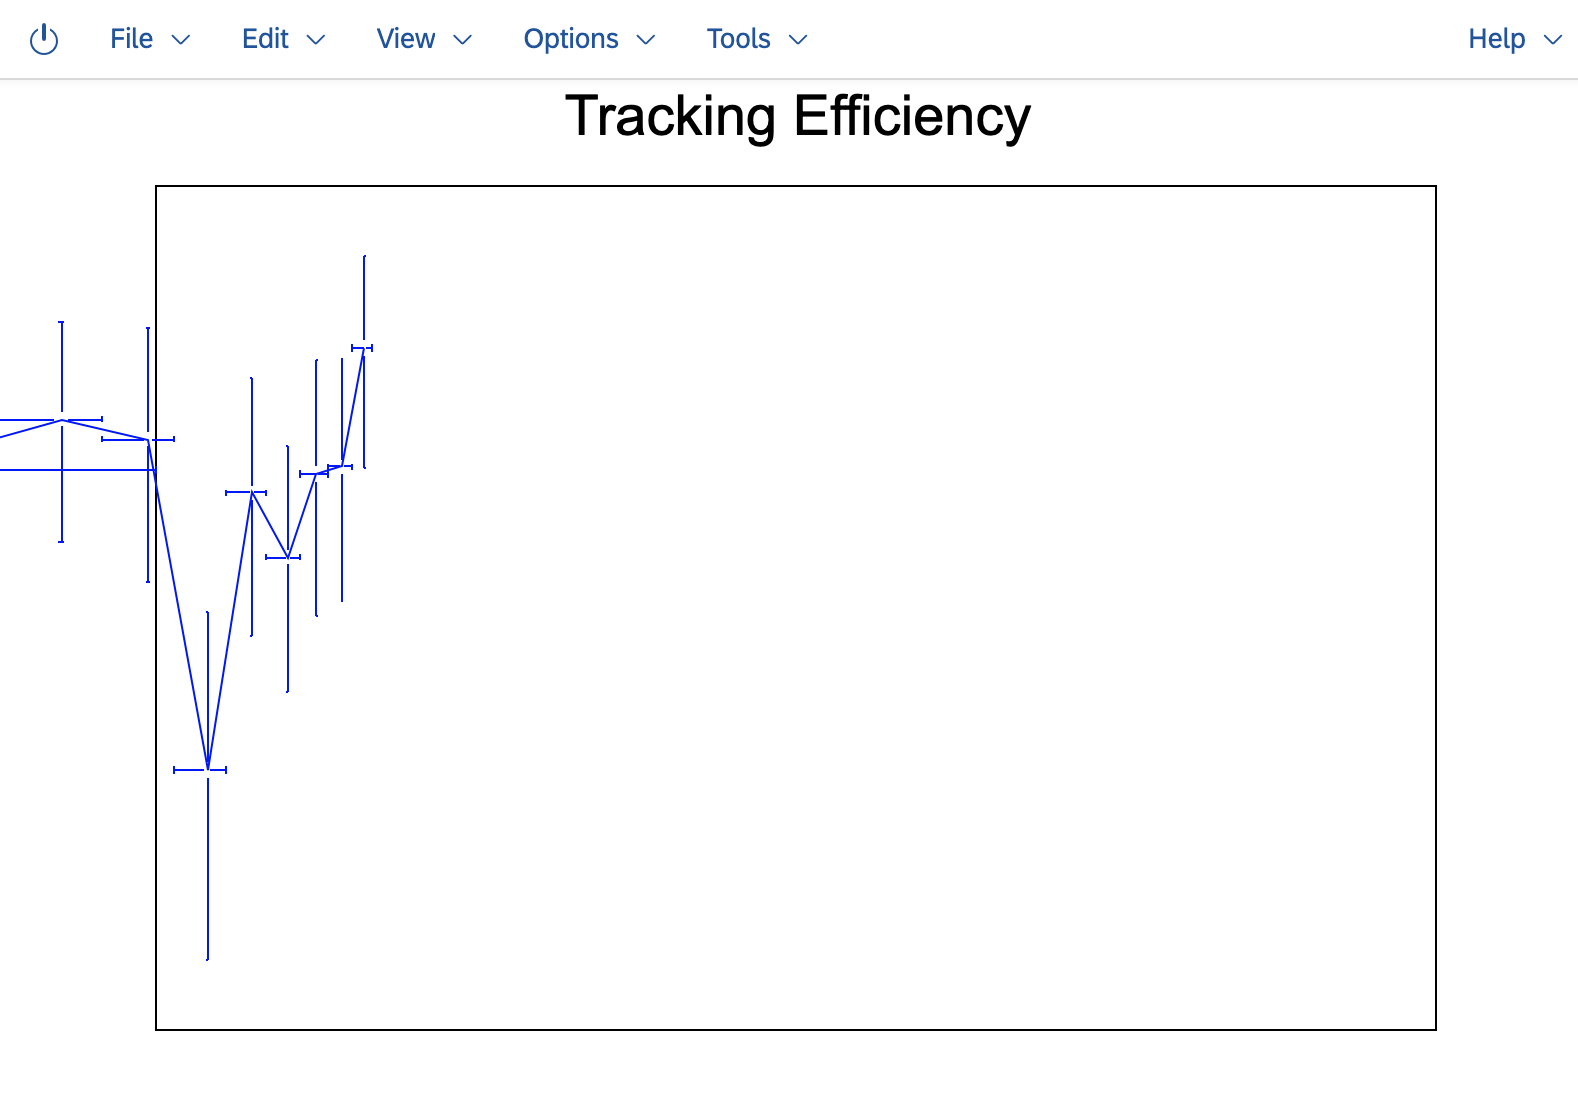
But the minute I turn it on it breaks.
How do I make the underlying graph aware that it is drawing on a log canvas?
I was already based off master which caught me by surprise since I could reproduce this in both my master build and a conda build (ROOT-6-36-06) which is why I didn’t mention my version in the above.
I did a little more digging turns out this only happen when I try to do the above plot in a notebook environment (for fine tuning) regardless of the root version.
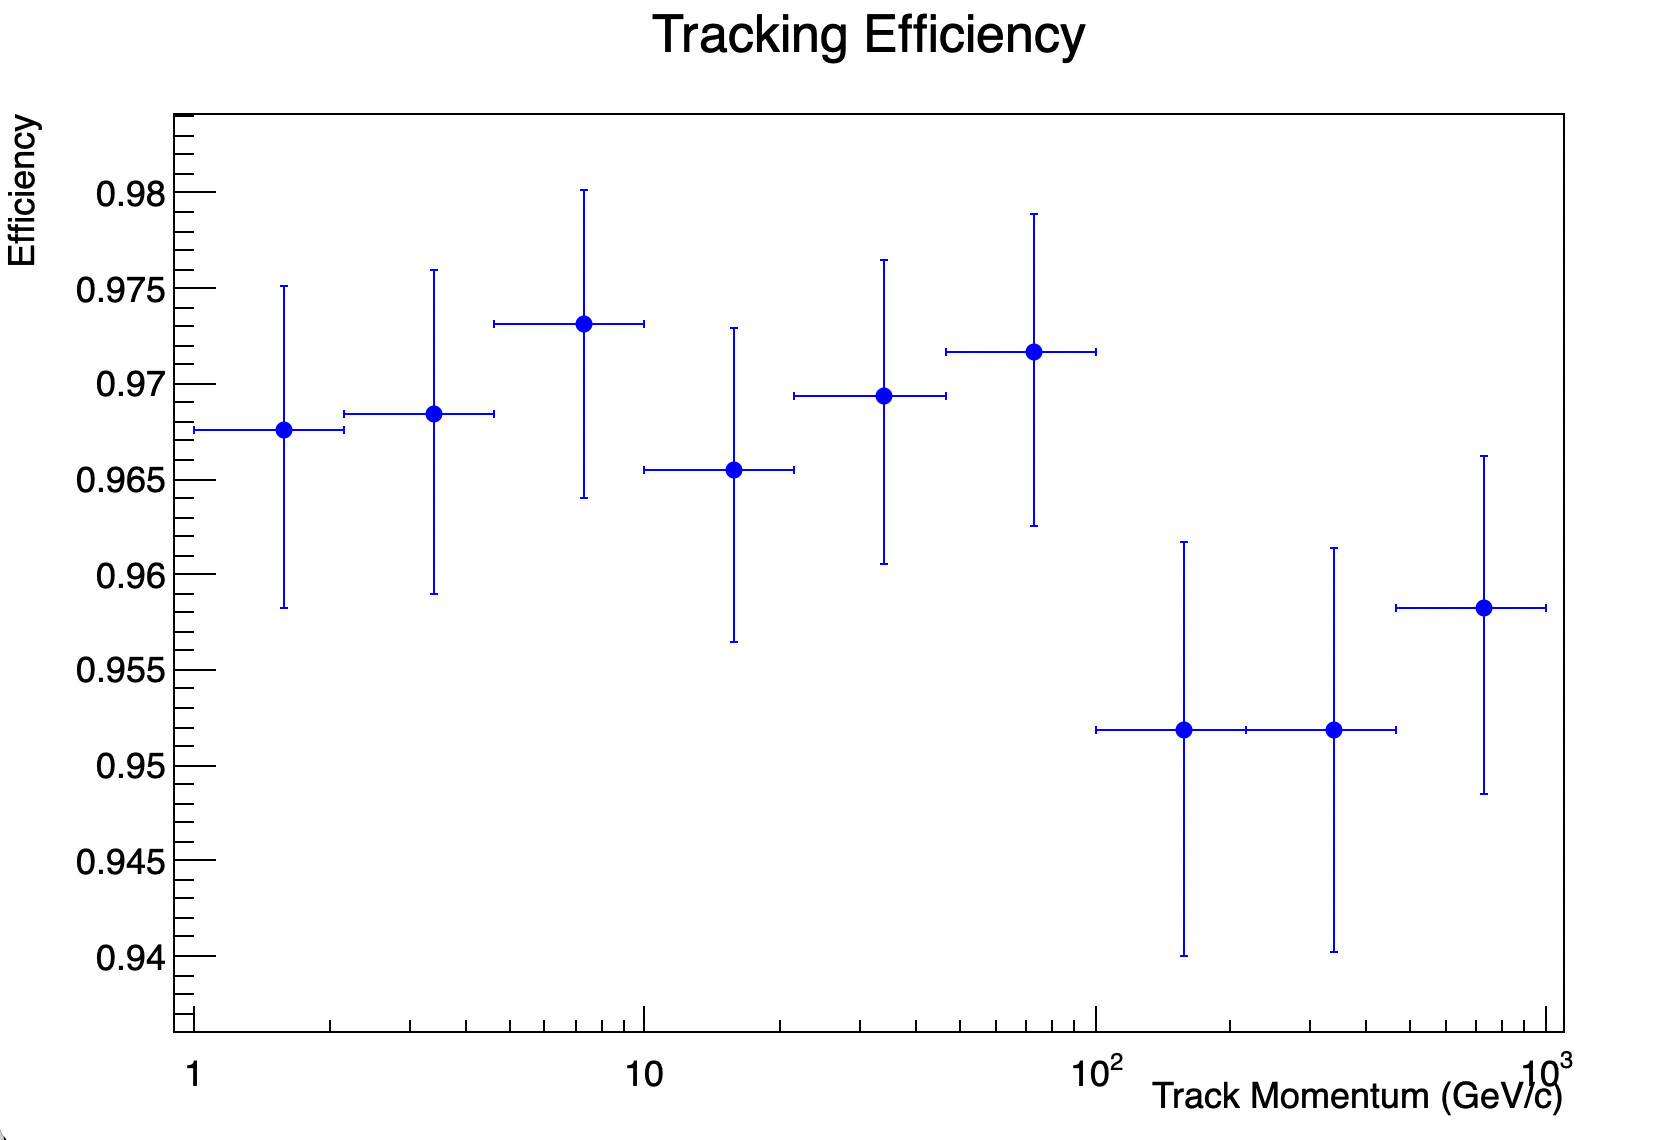
The minute I run it as a python script the plot seems to work okay. Sorry about that should I checked this before I posted.
Thanks a lot. I just continue with as a python script instead.
P.S Here is an attachment of my notebook render if it helps.