Tefficiency problem with x axis

Dear experts,
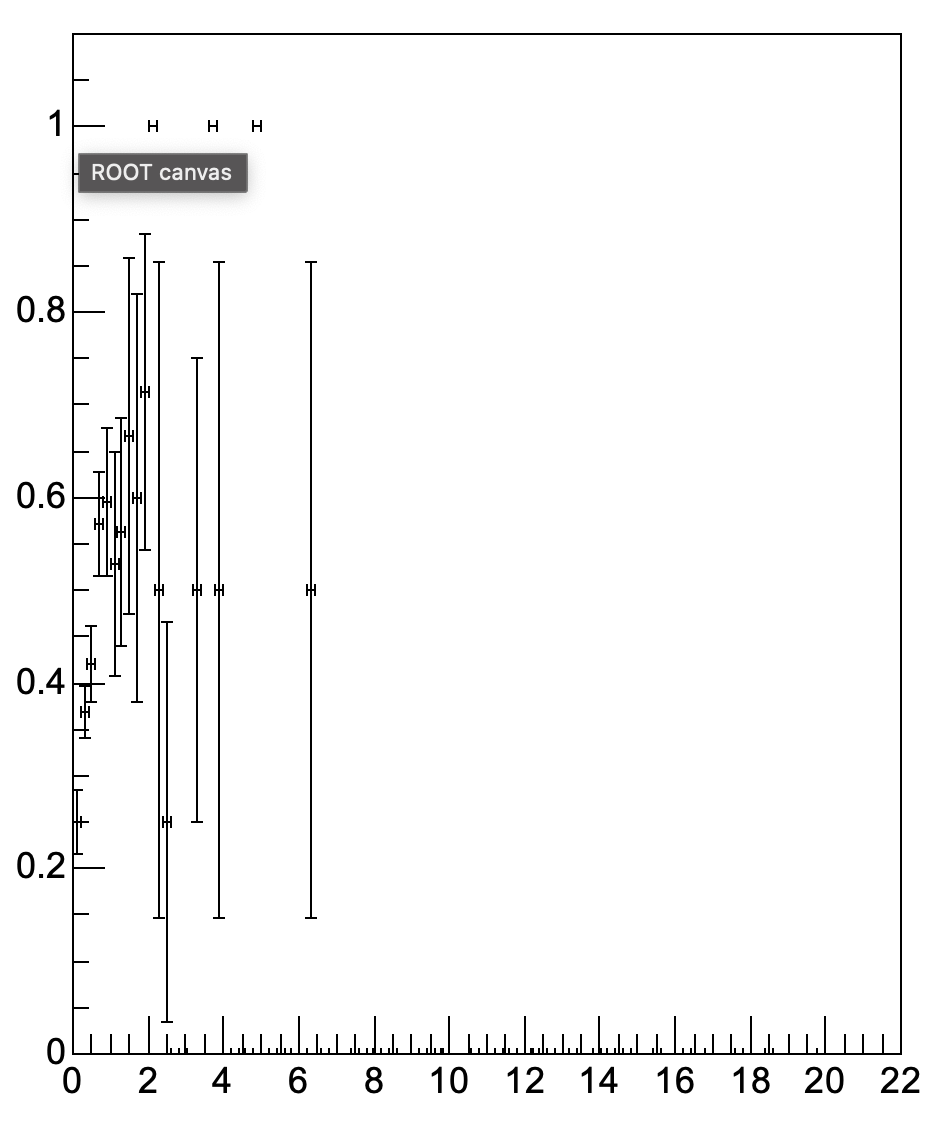
I have a problem with a TEfficiency object. As you can see in the attached figure, there is a problem with the ticks on X axis. It also has a title which does not appear.
Is there a problem with how it is filled?

Thank you in advance!

the code used:
mPassed = new TH1F(“mPassed”, “passed; dNdPt”, nbinsPt, xbinsPt);
mTotal = new TH1F(“mTotal”, “total; dNdPt”, nbinsPt, xbinsPt);
mEff = new TEfficiency(“eff”, “eff vs pt”, nbinsPt, xbinsPt);
mPassed->Sumw2();
mTotal->Sumw2();
mEff->SetTotalHistogram(*mTotal, “f”);
mEff->SetPassedHistogram(*mPassed, “”);

Yes these “extra little ticks” are weird. do you have some complete code we can run ?

that is a little bit complicated since this is part of a larger o2 code with many structures inside it, sorry if it’s too little information.
a more general question would be if you know that it would have something to do with the bins where there is no data, if any? i was thinking about this since the ranges of both total and passed hists are (0.01, 20) and this is not taken into account in the resulting efficiency plot, which seems to me that the result does not seem to be computed bin by bin.

may be save that plot as a root file or a .C macro and we might see from where these extra ticks come.

I bet - there are points near y == 0 line.
One can see remains of error bars and markers.

1 Like

Yes that can be that too…

This topic was automatically closed 14 days after the last reply. New replies are no longer allowed.