I recently discovered that TCutG objects are always plotted as straight lines connecting points even if on a log axis. This can lead to misleading cuts. Say I draw a nice and square box around my data that happens to be exponential and plotted on a log plot and then use that cut to only look at that data. The result is not what one would expect as the cut needs to be evaluated against the data in linear space due to the plotting.
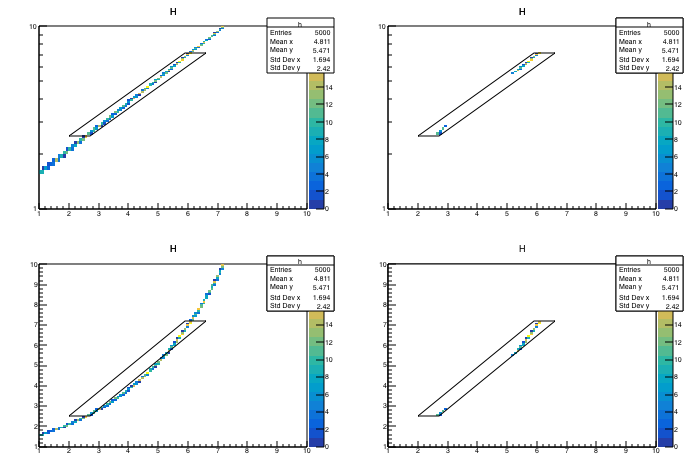
Below is an example where I created a cut around the data in the top left on a log plot. I then try plotting only the gated data in the top right and see a gap in the middle of the cut, which is not expected. Plotting in linear space in the bottom right we see that the cut and data do not overlap in the middle of the cut. Using this cut in linear space (bottom right) properly represents the expected behavior.
I believe this effect is also true for TGraph objects. Points are interpolated with linear lines whether plotting in linear or logarithmic space. Since TCutG inherits from TGraph it has the same issue.
Is there an easy way to interpolate the points with a logarithmic curve?
Yes this is the same with TGraph. In log scale there is no intermediate points added between two points in order to draw the line connecting them in log scale. Only the points building the graph are changed into log. The connecting line stays linear. So if the space between points is large you can see the effect you describes.
Either you should avoid to draw the TGraph with line or you can increase the number of points,
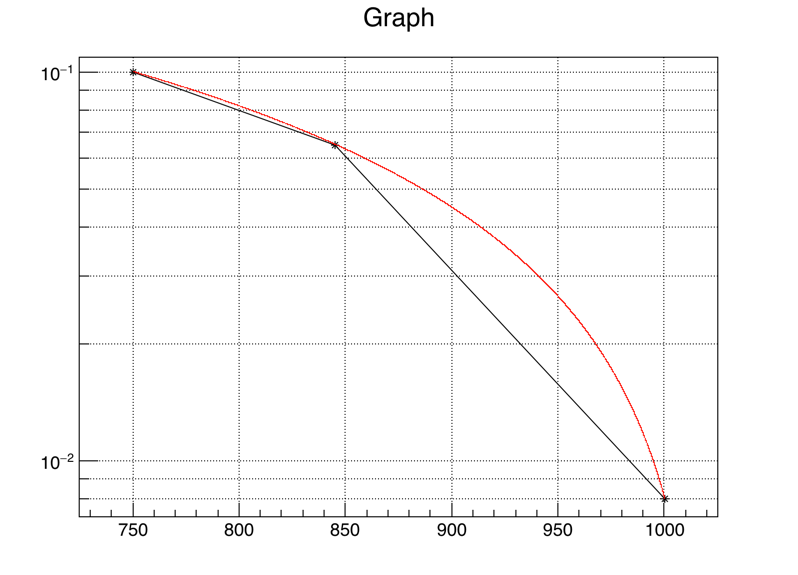
The following example illustrate this:
{
   // A graph with 3 points
   Double_t xmin = 750.;
   Double_t xmax = 1000;
   TGraph* g = new TGraph(3);
   g->SetPoint(0,xmin,0.1);
   g->SetPoint(1,845,0.06504);
   g->SetPoint(2,xmax,0.008);

   // the same graph with n points
   Int_t n = 10000;
   Double_t dx = (xmax-xmin)/n;
   Double_t x = xmin;
   TGraph*g2 = new TGraph();
   for (Int_t i=0; i<n; i++) {
      g2->SetPoint(i, x, g->Eval(x));
      x = x + dx;
   }
   TCanvas* cv = new TCanvas("cv","cv",800,600);
   cv->SetLogy();
   cv->SetGridx();
   cv->SetGridy();
   g->Draw("AL*");
   g2->SetMarkerColor(kRed);
   g2->SetMarkerStyle(1);
   g2->Draw("P");
}
That’s how it is implemented now. I am afraid the only way is increasing the number of points. The only other way would be to artificially increase the number of points at drawing time without telling the user. That was not the choice made in the early implementation of TGraph, TLine etc …
My chief concern is when using the GUI to draw the TCutG on a log plot and then thinking that this gate would include the data selected, but find out It was not representative of the actually produced gate.
I will have to remember that TCutG should only be compared to data in linear space. Perhaps a warning in the documentation is warranted?
{
//Create some data
TH2D *h = new TH2D("h","",100,1,10,100,1,10);
h->SetStats(false);
for (int i=0;i<5000;i++) {
double rand = gRandom->Gaus(10,5);
h->Fill(rand, 1.15 * exp(0.3 * rand));
}
//Create a cut (this could be done in the gui).
TCutG* cut = new TCutG("cut", 5);
cut->SetPoint(0, 2, 2.5);
cut->SetPoint(1, 5.9, 7.18);
cut->SetPoint(2, 6.6, 7.18);
cut->SetPoint(3, 2.7, 2.5);
cut->SetPoint(4, 2, 2.5);
cut->SetLineStyle(2);
cut->SetLineColor(kRed);
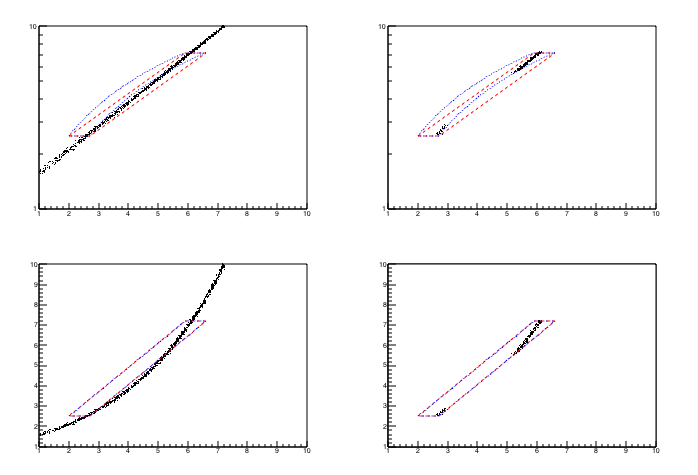
//Create a new interpolated cut, to compensate for log plotting.
TCutG* interpolatedCut = new TCutG("cut2");
interpolatedCut->SetLineColor(kBlue);
interpolatedCut->SetLineStyle(3);
const int numSteps = 100; //Number of interpolation steps between each point.
//Loop over points in original cut
for (int i=0;i<cut->GetN() - 1;i++) {
//Compute the linear interpolation
double slope = (cut->GetY()[i+1] - cut->GetY()[i]) /
(cut->GetX()[i+1] - cut->GetX()[i]);
double intercept = cut->GetY()[i] - slope * cut->GetX()[i];
//Set a new point for each interpolation step
// (should do this in logarithmic steps)
double x = cut->GetX()[i];
double stepSize = (cut->GetX()[i+1] - x) / numSteps;
for (int j=0;j<numSteps;j++) {
double y = slope * x + intercept;
interpolatedCut->SetPoint(numSteps * i + j, x, y);
x += stepSize;
}
}
//Include final point.
interpolatedCut->SetPoint(interpolatedCut->GetN(),
cut->GetX()[cut->GetN()-1], cut->GetY()[cut->GetN()-1]);
TCanvas *c = new TCanvas("c", "C");
c->DivideSquare(4);
//Plot all data in log space.
c->cd(1)->SetLogy();
h->Draw("");
cut->Draw("SAME");
interpolatedCut->Draw("SAME");
//Plot selected data in log space.
c->cd(2)->SetLogy();
h->Draw("[cut]");
cut->Draw("SAME");
interpolatedCut->Draw("SAME");
//Plot all data in lin space.
c->cd(3);
h->Draw("");
cut->Draw("SAME");
interpolatedCut->Draw("SAME");
//Plot selected data in lin space.
c->cd(4);
h->Draw("[cut]");
cut->Draw("SAME");
interpolatedCut->Draw("SAME");
}