Hello, some days ago, I used this macro TBAlign.C (26.3 KB) TBAlign.h (4.3 KB) fit_line.C (1.2 KB)
to traslate the local x coordinates of events read by 3 trackers (called 33, 35 and 37)
stored in this Root file
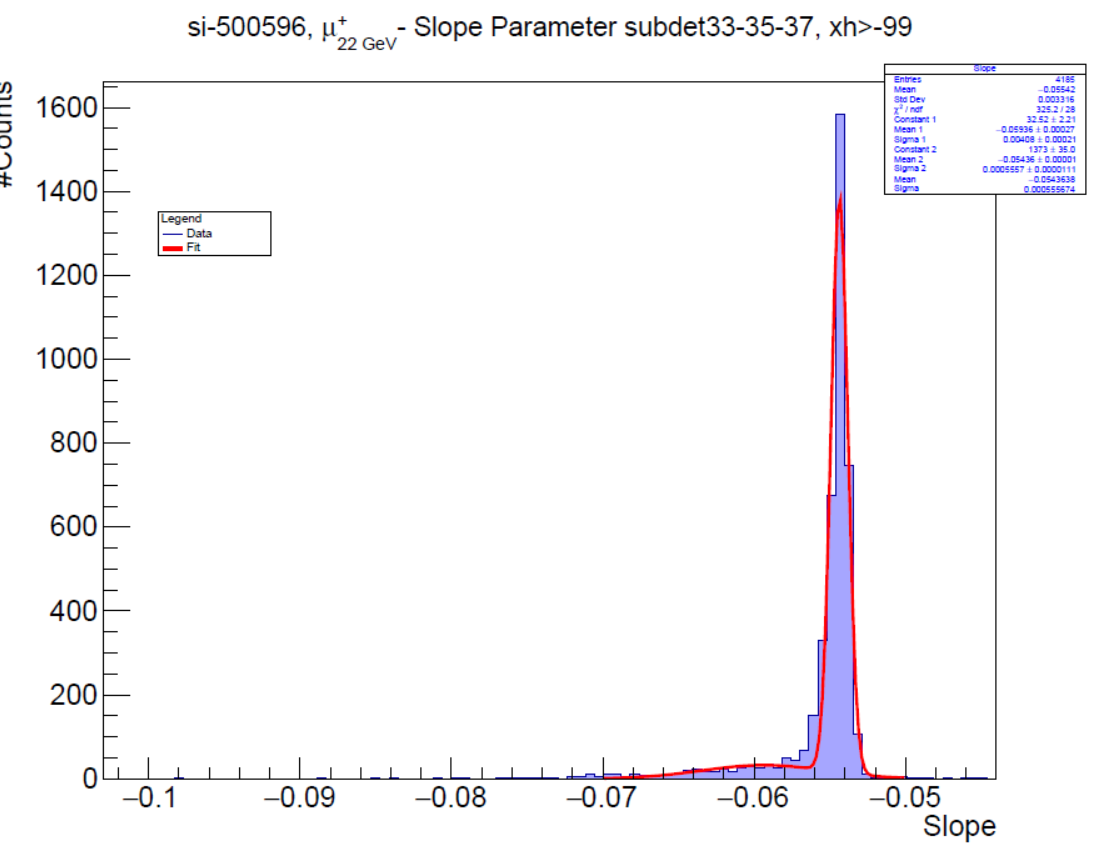
to the laboratory ones and I stored the them in the arrays x33[0], x35[0] and x37[0]. Moreover, I fitted the events of the x33[0], x35[0] and x37[0] using the fit_line function and I stored the slope values in the bpar[0] array.
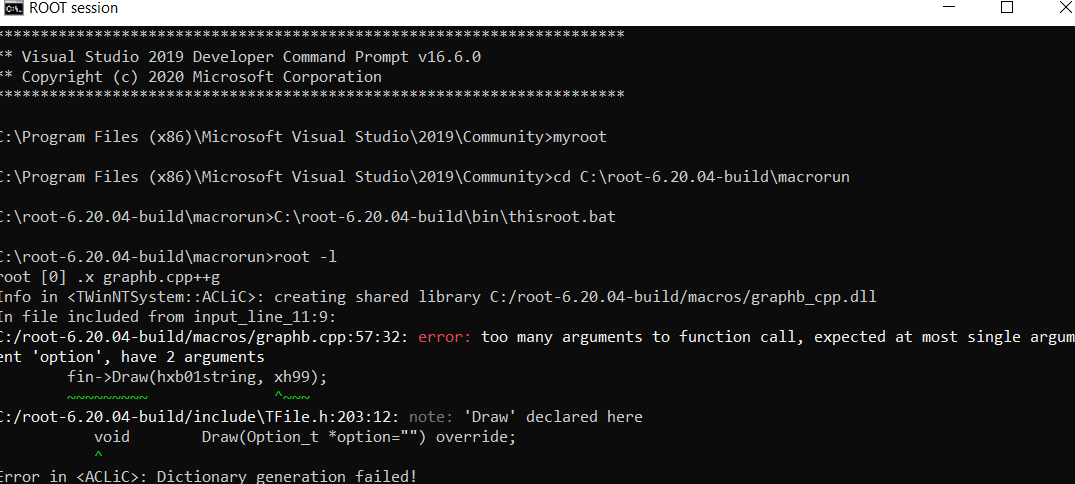
Today I had to plot the bpar[0] distribution for the events simultaneously read by the three trackers i.e. when x33[0] && x35[0] && x37[0] are NOT empty. so I added the code
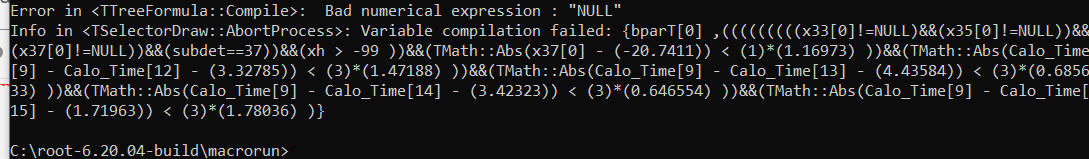
Error in <TTreeFormula::Compile>:  Bad numerical expression : "hxb01"
Info in <TSelectorDraw::AbortProcess>: Variable compilation failed: {hxb01 ,bpar[0] > -0.006 }
In your file, hb333537 (hxb01) is a histogram separate from the tree lemma (fChain), and it’s not recognised as a variable in lemma.
Additionally, you mention you want bpar[0] > -0.006, but looking at the plot, that would cut out all the data in that histogram (if b[par] is indeed “slope”).
Since you created the hb333537 histogram in the first place, why not bypass this hb333537 histogram, and instead create another TTree with the events from your initial selection (i.e. same events that were used to fill hb333537), whatever it was, but containing their “slopes” and “bpar” (and any other variables you may want to use for additional cuts)? Then you can just read this new tree and cut using variables inside it. There may be other ways starting from what you already did, but this should work.
i.e. I store bpar[0]=b in the Root file. But when I plot bpar[0] I get more tha 4185 events…then I think that ROOT creates empty culomns when there are not the three hits…that’s because I filled hb333537. Indeed in a first time, I didn’t fill hb333537 but I used this macro
if (subdet37 && xh99) hbT->Fill(bpar[0]);
					if (subdet37 && xh99 && cutx37 ) hbTx37->Fill(bpar[0]);
					if (subdet37 && xh99 && cut90 ) hbTx37LG0->Fill(bpar[0]);
					if (subdet37 && xh99 && cut912 && cut913 && cut914 && cut915 ) hbTx37H->Fill(bpar[0]);
but when I plot… I get 4185 event in all the plots, but I know that it is wrong… because for example there were 3 lead glasses and not all the events went passed through the lead glass 0 (i.e. cut90).
In your macro graphb.cpp it seems you are accessing the TTree lemma in the .root file you posted earlier. Then it that TTree (lemma) you try to draw the variable bpar … but there is no variable bpar in the TTree lemma… did I missed something ?
Hi @couet, maybe did you open the file si-500596.root? The bpar[0] is in the file si-500596-trasl.root because I create this branch by the TBAlign I don’t know if you remember, we talked about this macro in this topic Fit of an array with @Wile_E_Coyote .
By the macro TBAlign I traslated the local coordinates to laboratory ones, moreover, I fit the events in the three trackers and I also fill the bpar[0] (the slope of the fits).
but I got 0 events the I said it to my supervisor and his colleague and he said me that this code doesn’t work and I’ve to set the condition that x33[0] && x35[0] && x37[0] .
You see, yesterday I was able to fill a histogram for events having hits in the three trackers but I also have to apply other cuts and it looked like that the Tcut didn’t work for a filled histogram…
Now I also tried to add in the TBAlign a new array in this way
if (x33[0]!=NULL && x35[0]!=NULL && x37[0]!=NULL) bparT[0]=b;
but in this way I get the same events that I get just for bpar[0]=b