Hi guys,
someone has an idea how to fix this? I think it should depend on the canvas size in my macro.
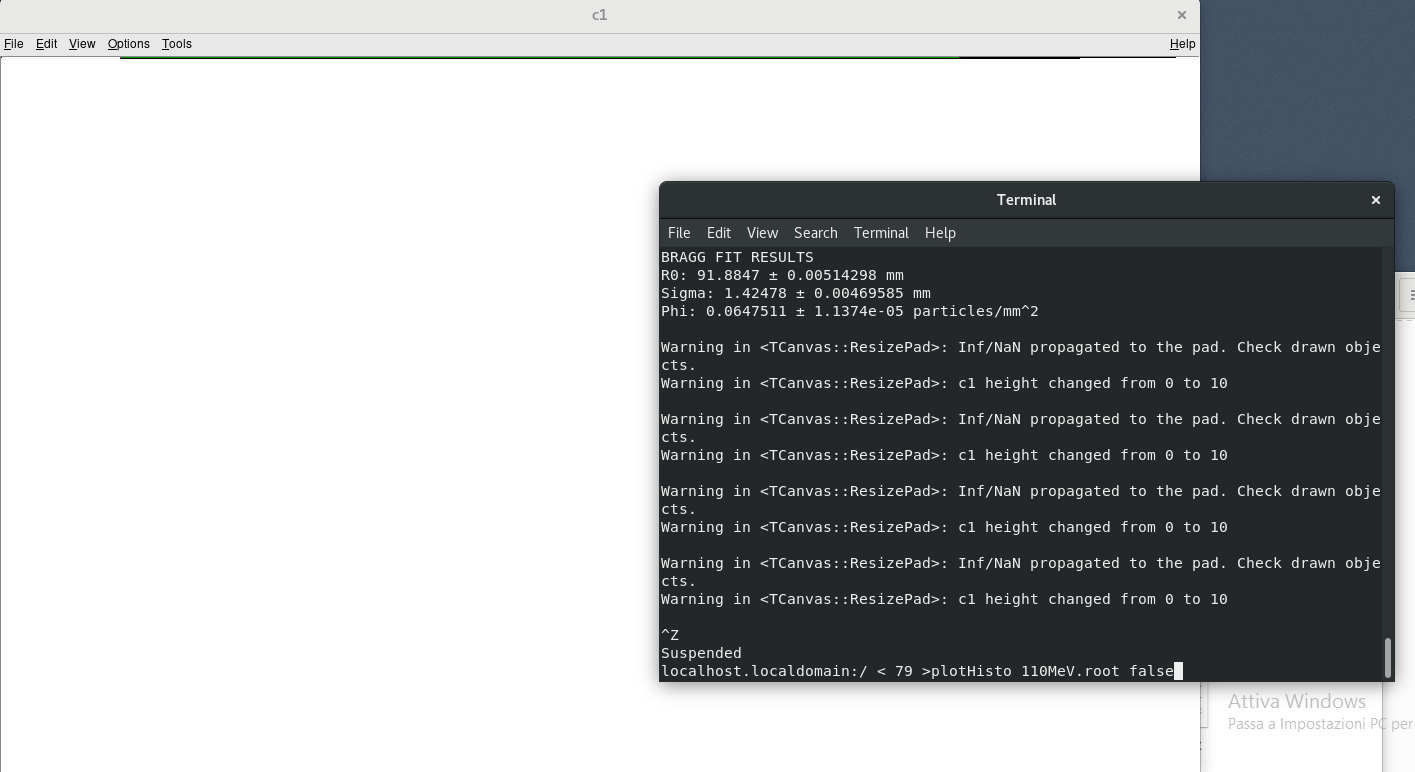
That’s not a Canvas problem, it shows up at the drawing time, but very likely the data you are trying to draw contain NaN and/or Inf.
Hi, what do you mean by dat?
Just to be clear, this macro analyzes some data from a root file I can get at different values. The problem is when I work at low energies. Starting from a given energy the macro runs correctly.
I mean some of your data should be invalid: Nan or Inf. what are you data ? histogram ? tree ?