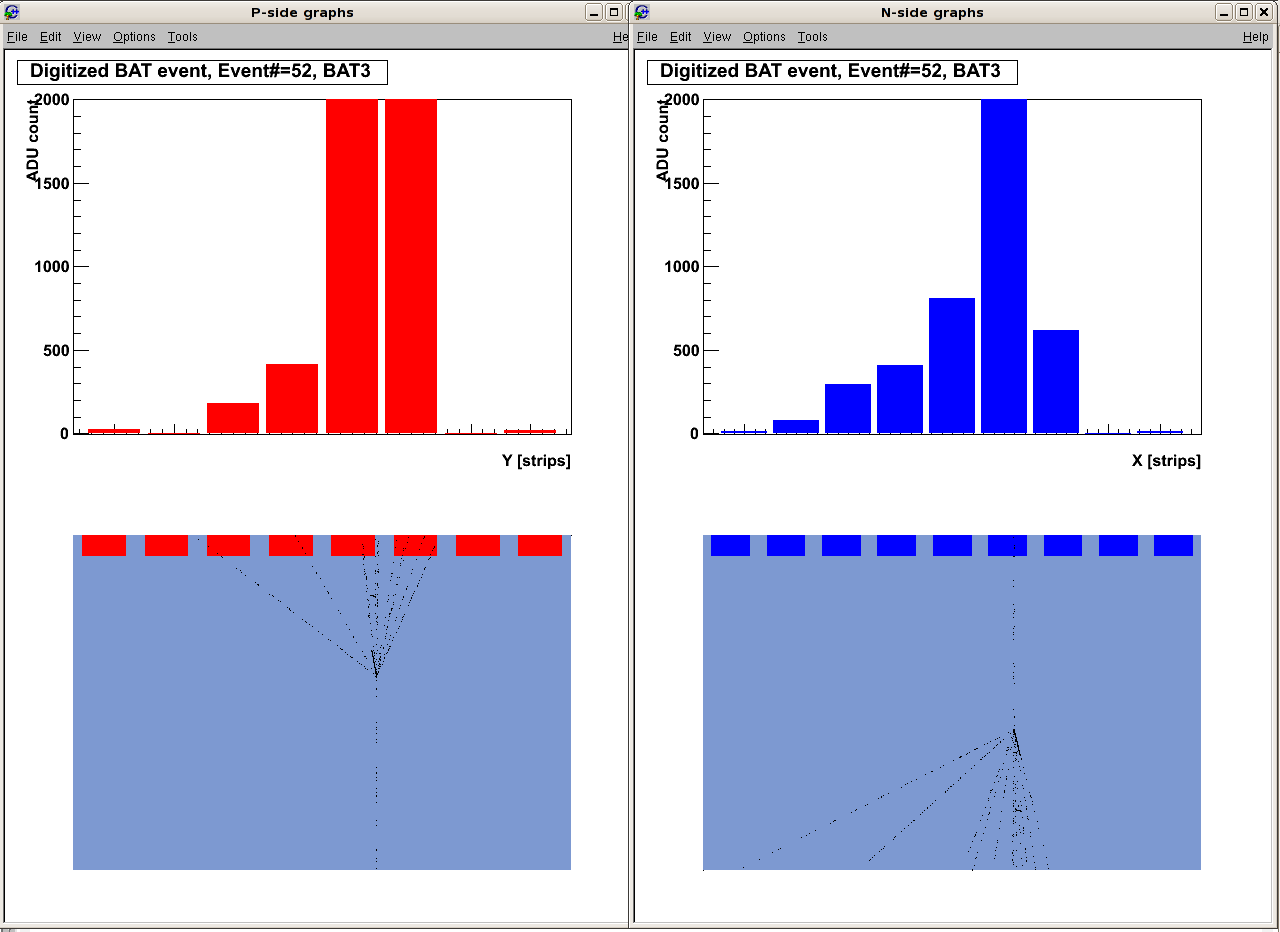
I am making a simulation of a silicon strip sensor, and for debugging/documentation I have a PyRoot program that draws a plot of sensor response together with the simulation hits (energy depositions). The plots look like the attached image bubble.png.
However, trying to save the content of the canvases result in parts disappearing (in the plot) – for example the sensor view or the bargraph. I had similar problems trying to plot all into one large “2x2” canvas with four pads.
from a cursory look at the code, I’d say that certain graphics elements (such as the TGraph referenced by the “barChart” variable) will be garbage collected when all references to them go away in the next cycle of the loop.
Keep them alive with the canvas, e.g. by doing:canvas._barcharts = [] # once
canvas._barcharts.append( barchart ) # in loop
Alternatively, you can release the python-side ownership, but then you have to make sure that the objects are owned on the C++ side.
This solved part of the problem – the barcharts don’t disappear anymore. But the graphics “down below” does, and only on the P-side (layer 1).
The really strange thing here is that if I take click on the downmost pad on the P-side and “drag” it a little, the problem goes away untill the next time the program starts. (or it did - until i changed a few, unrelated lines of the program?!?)
Maybe if I throw them all into one big 2x2 canvas like it was originally done? It’s still really strange…
TbModules etc. is a bit hard to post here, as it is a rather large piece of code for reading simulation hits, simulating detector response, and writing out detector digits. And then you’ll need the data (~1 GB for one (largish) run)…
I rewrote the code a bit (attached) so that it draws into a 2x2 canvas. It now works like this:
Calling canvas.Update(), clicking on the canvas, or saving to .png (from the menu) will erase the drawings underneath, while making the graphs visible
The drawings are made visible (if not removed by an Update() ) by hiding and then showing the window containing the canvas (window manager minimize/restore, hide underneath other window/out-of-screen etc.) - but then the graphs on top are not visible.
I can’t see why the drawings should go out of scope, they should belong to the pad, which I still have a pointer to when calling Update() (either accessible by canvas.cd(padnum), or near the print “pause”, via the variable “pad”…
Maybe ROOT expects the program to redraw anything created with “low-level” commands every time Update() is called? TbAna_clusterBarchart.py (8.88 KB)
Maybe the best way is to use four separate canvases (or at least separate graphs and drawings), and then some program to stich toghether the output files?
pad.DrawBox() are methods that are not really intended to be used directly by the user.
Instead you are supposed to create “Graphics Primitives” like “TPolyLine” and “TMarker”, and “Draw()” them to the pad, which will add the objects to a doubly linked list contained in the pad, holding the objects that has been drawn to it. root.cern.ch/drupal/content/graphics-pad
This should really be mentioned in the reference guide!
Attached working code, in case anyone else has the same problems and this turns up on Google… TbAna_clusterBarchart.py (8.86 KB)